
Introduction
Litecoin (LTC) in the first quarter of 2019 saw a huge increase in mainstream and speculative adoption. Read on as we go over the major technical patterns and interesting news driving the price of the LTC.
Beam and Litecoin Implement Mimblewimble
On February 7 ’19, a collaboration between Beam and Litecoin was announced on Beam’s Medium blog post, with a mission to implementing a new protocol named “Mimblewimble” for enhancing the privacy and scalability of the network. This project, which will be issued under an open source license, is already exploring privacy and fungibility into Litecoin.
[rml_read_more]
China’s CCID Crypto Ranking Shows Litecoin Overtaking NEM (XEM)
The CCID – Center for information and Industry Development in China, released its monthly report on February 26. This release put EOS on the number one spot, Tron passing Ethereum, and also saw Litecoin shoving NEM (XEM) to the 35th and last position.
TheLitecoin’s Partnership with Glory Kickboxing as Leagues official Cryptocurrency
On 26 February ’19 in a formal press conference, the Litecoin Foundation declared its alliance with “Glory” Kickboxing, as the league’s official cryptocurrency for online merchandise and international events.
This a move in the right direction as the number five cryptocurrency by market capitalization started this move towards mass adoption by an earlier sponsorship of the MMA.
This new move will start with the integration of LTC into gloryshop.com, the leagues online merchandise store.
2nd Annual CHAINERS Blockchain Week—CHAIN PLUS+
23 -24 January 2019
This was a two day summit hosted by Chainers and Korea Media giant MTN group at the Seoul Dragon City Hotel in Seoul South Korea.
The event was supported by The Blockchainer, BlockchainI, JLAB, JRR Crypto, TimeStamp Capital,ONT Eco,Consensus Investment, Blockchain Investment.
LTCUSD: MONTHLY
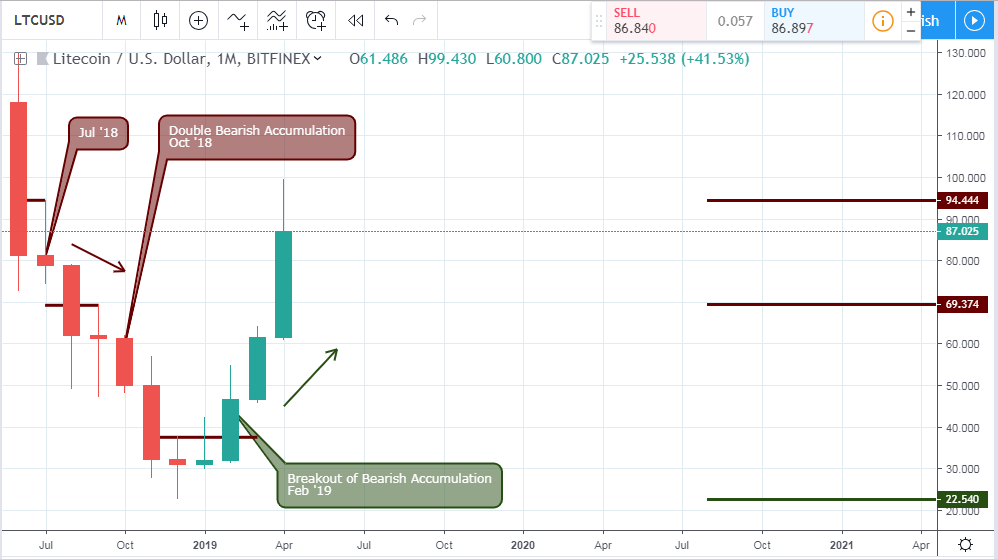
A breakout of bearish divergence on a monthly chart is a signal recognized by many as a very probable reversal pattern. Following a sequence of continuous bearish closing bars on the monthly chart of the LTCUSD, the pair burst out of a bearish accumulation resistance at 37.687. The closing price of February does not only signal reversal for Litecoin, but a hint at a broad recovery of the entire cryptocurrency ecosystem. That said, the price is projected to approach the previous bearish accumulation resistance levels at 69.374, 94.444 and 130.00 respectively.
LTCUSD: Weekly
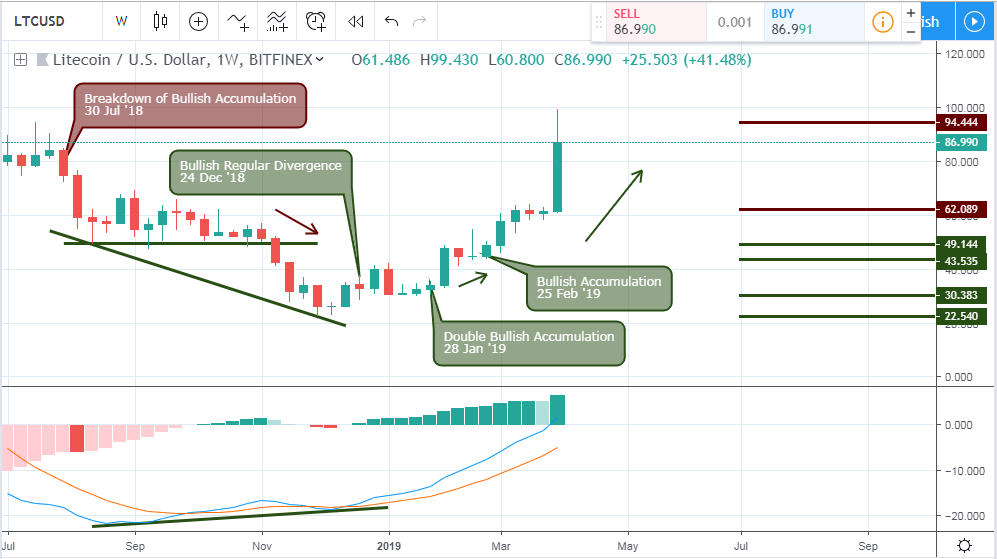
The weekly chart of the LTCUSD threw more light at the bottoming of the oversold bearish trend. Looking at the chart above the last quarter of the year, 2019 transitioned into bullish regular divergence pattern on 24 December 2019. The bullish trend was reinforced by a double bullish accumulation pattern triggered on 28 January ’19 and another bullish accumulation pattern on 25 February ’19, bringing clarity towards going long on the LTCUSD. From the double bullish accumulation pattern in the first quarter of 2019, the price of LTC soars higher by 193.6%.
LTCUSD: Daily
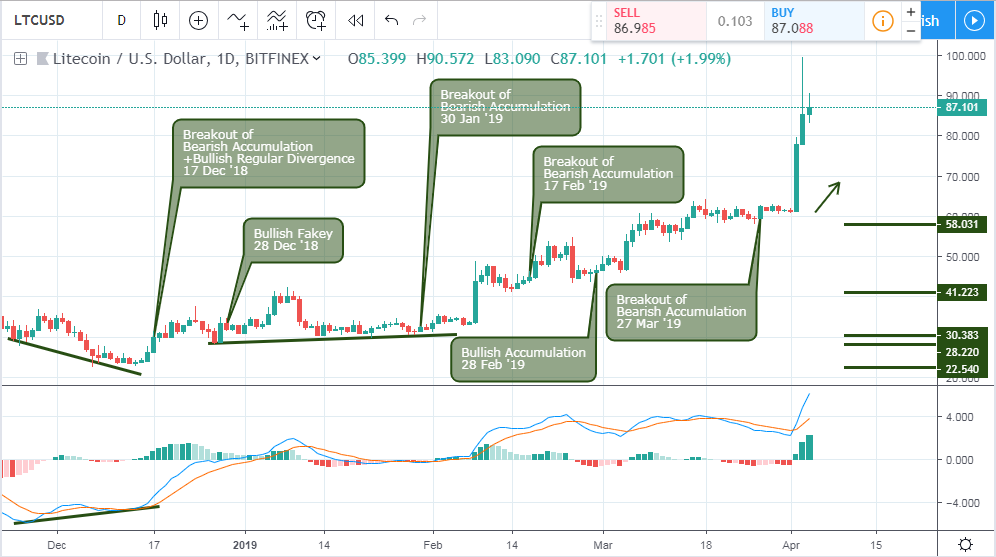
A closer zoom to the daily chart reveals a regular bullish divergence pattern reinforced by a simultaneous breakout of bearish accumulation. Another follow up of hidden bullish accumulation confirmed a continuation of the trend, in combination with a breakout of another bearish accumulation on and 30 January ’19. The bullish trend of the LTCUSD persisted further by triggering a breakout of bearish accumulation on 17 Feb ’19 and 27 March ’19, forcing the price to rise by 58% and 127.8% respectively.
LTCUSD: 4HR
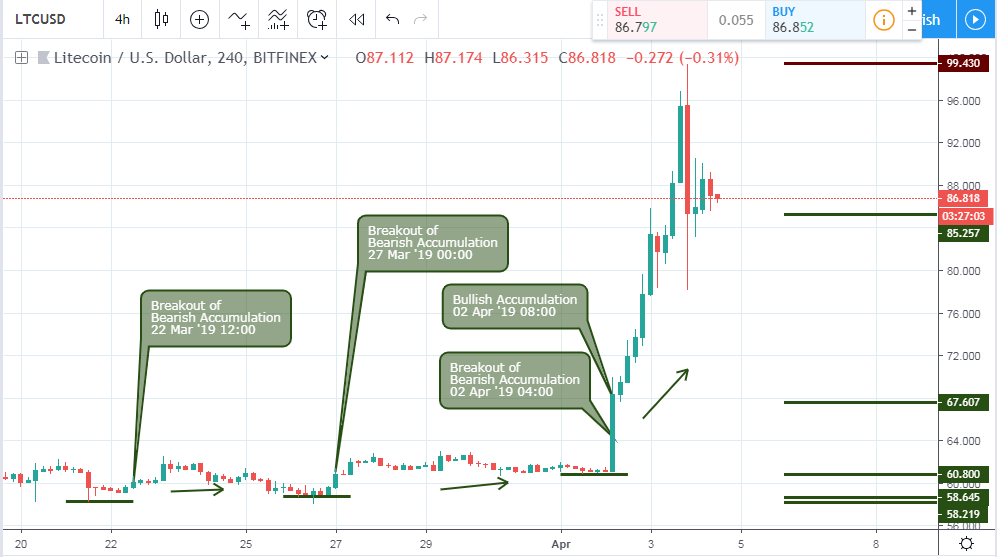
All attempts by sellers to redeem their image and resume the bearish trend failed in a series of breakout of bearish accumulation on 22 March ’19 12:00, 27 March ’19 00:00, and finally skyrockets in Q2, on 02 April ’19 04:00. Bullish accumulation patterns are currently triggered on 02 April ’19 08:00 and 04 April ’19 04:00.
Significant Price Levels
LTC (LTCUSD) Resistance
Monthly
153.01, 94.444, 69.374
Weekly
94.444, 69.374, 62.089
Daily
100.00
4-Hour
99.43
LTC (LTCUSD) Support
Monthly
22.540
Weekly
22.54, 30.383, 43.535, 49.144
Daily
22.54, 28.22, 30.383, 41.223, 58.031
4-Hour
58.219, 58.645, 60.80, 67.607, 85.257
Conclusion and Projection
A breakdown of the bullish accumulation triggered on 04 April ’19 04:00 will indicate a weakness of the current bullish trend of the LTCUSD. The trend is generally in a long term bullish trend and the 153.01 resistance for a long target is still feasible.
Featured image by Marco Verch