
The Bitcoin price has slumped within minutes as trading support pivoted after struggling to breach certain established resistance price levels on the higher monthly and weekly time frames, which is causing the Bitcoin price to plunge toward 5-month market lows.
[wlm_private “Crypto Trader Pro – Monthly|Crypto Trader Pro – Yearly|Crypto Trader Pro (Lite)”]
HODLers and bitcoin enthusiasts alike expected a breakout to the upside, but to their surprise, the price went south instead. A suspected culprit to the fall is from a significant fundamental factor in the news. Facebook’s Mark Zuckerberg happened to be on Capitol Hill giving testimony as the Libra project faces stiff regulatory hurdles.
It implies a resistance towards the mainstream adoption of Bitcoin and other crypto projects, at least by the U.S. government, and this has made market speculators really nervous, as indicated in the crypto markets.
In this post, we’ll be looking at the technical chart patterns that drove the price to the new 5-month low and speculate whether the price plunge continues or if there’s a chance for a reversal.
Technical Analysis
It’s been a struggle to get the Bitcoin price to close above the weekly bearish accumulation resistance of $8531.25 established after the September 30 ’19 close.
BTCUSD: Weekly
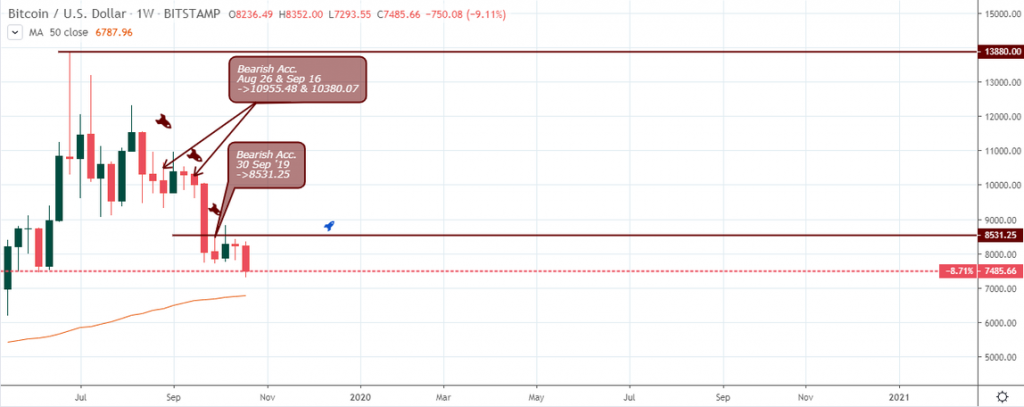
Although the sudden price drop on a lower time frame appears to be a big deal with no clear sign of support, the weekly time frame does reveals the MA-50 at $6,787.96, its likely support level, where a slowing of the price slump is expected. Even then, we can’t enter a long position yet without a high probability price action pattern.
BTCUSD: Daily
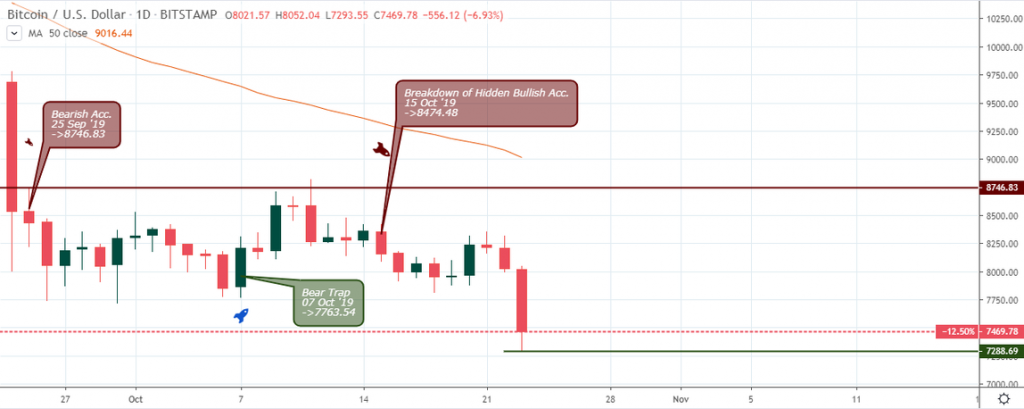
While the battle ensued between the bulls and the bears, the price chart assumed a range-bound formation on the daily, 4-hour, and 1-hour time frames. It was only a matter of time before the price broke below and exited the channel.
A significant resistance level on the daily time frame is the bearish accumulation on September 25 at $8,746.83. Notice the dark cloud cover candlestick pattern on October 11, that precedes the collapse of hidden support of $8,215.41 on October 14. From that point, it was clear where the price was headed. Price closed above the $8,746.83 resistance would have confirmed an exit from a short-sell order.
BTCUSD: 4-hour
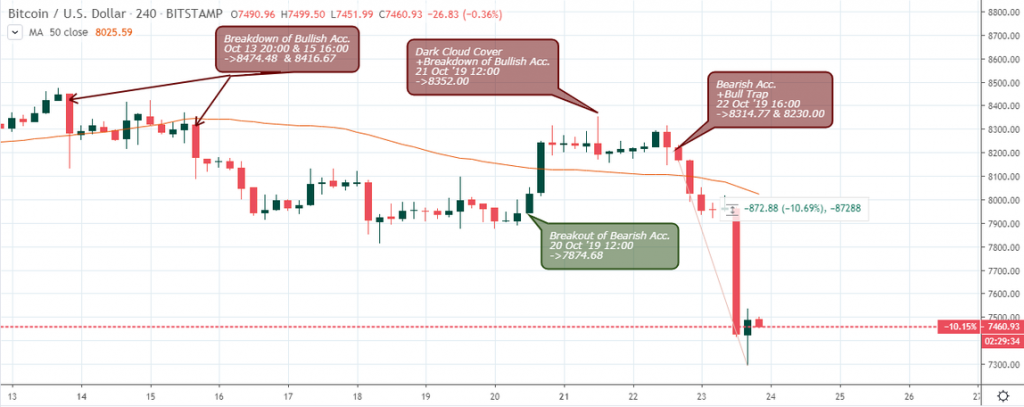
From the 4-hour chart perspective, bullish initiatives were truncated by an increase in sell pressure on October 13 at 20:00, and 15th at 16:00. A subsequent bull trap on October 22 at 16:00 forced the Bitcoin price below the MA-50. Eventually, a rough 10.69% price slump ensued.
The price close below the MA-50 on October 22, 20:00 depicts an exit of an overbought area, followed by a sudden rush in bearish momentum that knocked out long trader’s stop losses on its way down.
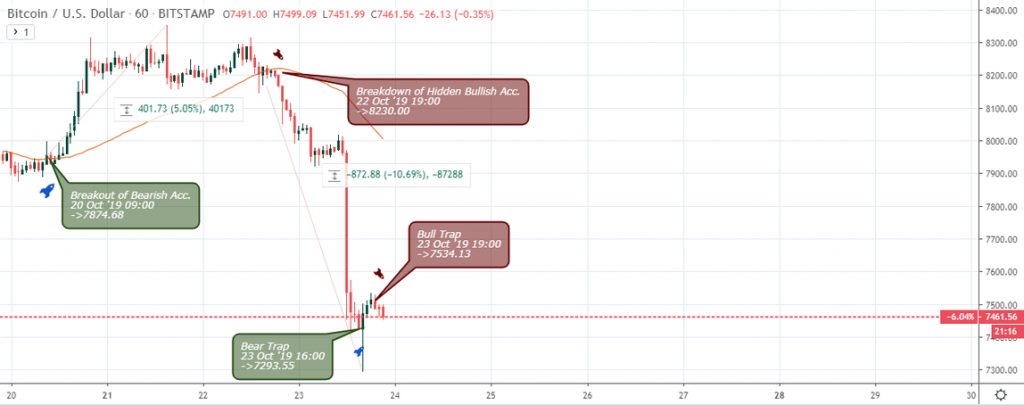
Conclusion and Projection
A breakdown below the bullish accumulation support at $8,018.98 on October 23rd is believed to have triggered a lot of stop-loss orders which consequently led to the price plunge, as shown on the 1-hour chart below.
In the coming weeks, we will watch if the bearish momentum can sustain the lower levels or if the price recoils back towards the upside.
We expect the recent bearish move to continue if the BTC price closes below the MA-50 from a weekly chart perspective, otherwise a reversal or side-ways market may occur.
Bullish reversal patterns on the weekly and daily time frames are more reliable bets compared to the lower 4-hour and 1-hour when considering a long position. Only time will tell how it all plays out.
Disclaimer
Content provided by CryptoTraderNews is for informational purposes only, and should not be construed as legal, tax, investment, financial, or other advice. All information is of a general nature. As always, there is risk with any investment. In exchange for using our products and services, you agree not to hold CryptoTraderNews Pro, its affiliates, or any third party service provider liable for any possible claim for damages arising from decisions you make based on information made available to you through our services.
[/wlm_private]
Want to read the rest of the article? Join our pro-membership and receive all of the following:
✅Access to ALL content.
✅Access to the CTN editorial staff.
✅Access to our CTN trading dashboard.
✅Access to our exclusive telegram channel where all our pro-members and editorial staff are in.
✅Ability to request content/research material!