
Both Apple Inc and Microsoft Corp stock prices are currently in a strong bullish trend, setting consecutive bullish closing candlesticks on the monthly time frame.
In this post, we’ll be analyzing the significant chart patterns that set the bullish undertone and the possibilities of scaling into this bullish campaign in both companies.
Analysis of Apple (AAPL) Stock Price
Apple Monthly Time Frame
The hidden bullish divergence pattern signaled on July 2016 confirmed a continuation of the bullish trend on the above monthly chart.
[wlm_private “Crypto Trader Pro – Monthly|Crypto Trader Pro – Yearly|Crypto Trader Pro (Lite)”]
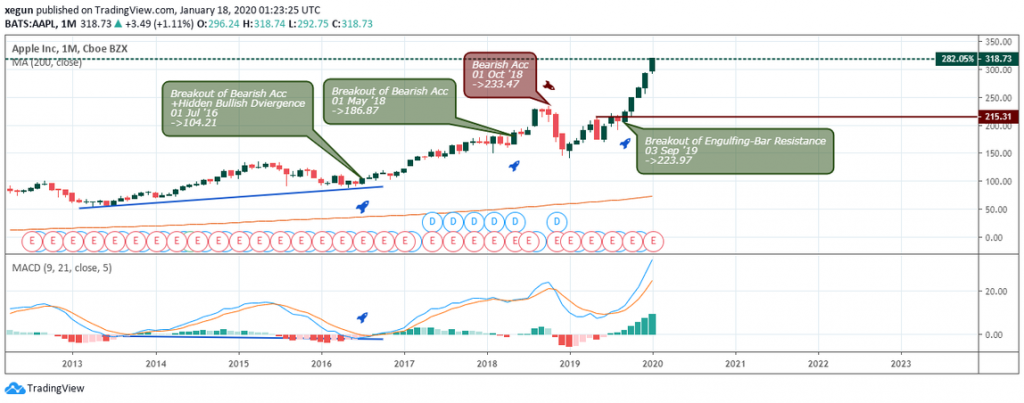
A not too distance break above bearish engulfing resistance on September 03 ’19 confirmed the consecutive bullish closing candles after the September 2019 breakout.
The price is clearly in the overbought stage and a high zone to take profit. For us to enter a long position at this point, we should wait for a correction phase, or we move to a lower time horizon to better time our entry point.
Apple Weekly Time Frame
The 200-weekly Moving Average is a significant zone where traders initialized their entries, following a price slump from the triple bearish accumulation pattern on October 22, 2018.
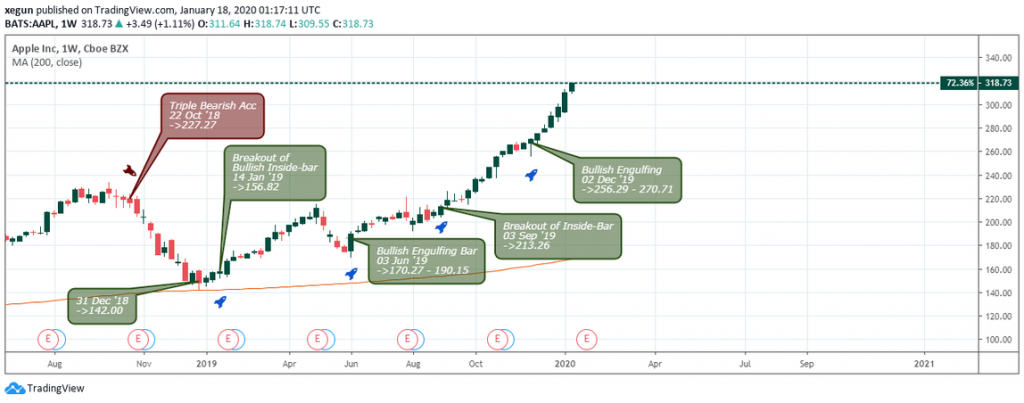
Bouncing off the MA-200, the AAPL price soared by 102.09% after a price close above the bullish inside bar candlestick pattern.
A second signal to enter a long position on the AAPL came after a bullish engulfing candlestick pattern, for a 67.63% price hike.
Apple Daily Time Frame Showing Hidden Bullish Divergence
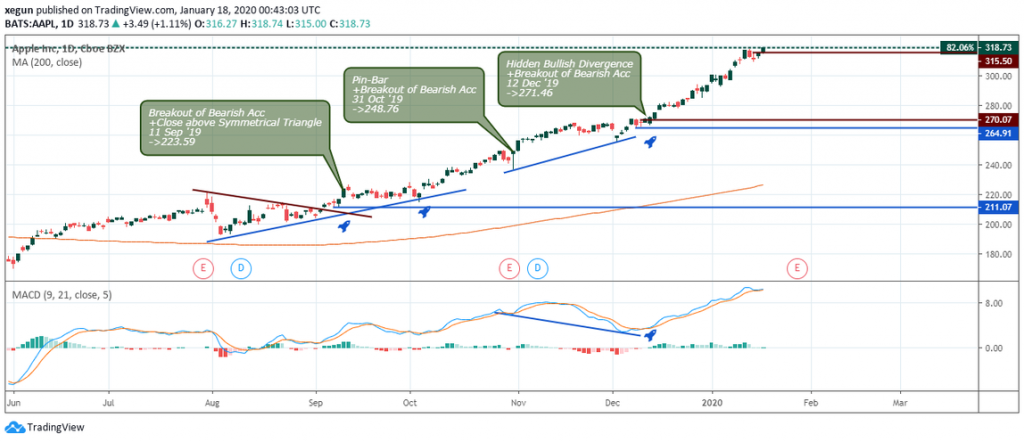
A view from the daily time frame shows the AAPL stock price enclosed within a symmetrical triangle, and it finally exited the resistance level on September 11, 2019 at 223.59 (42.5%), first long order entry into the then-impending bullish trend.
Subsequent signals to scale into the trade were fired on October 31, 2019 at 27.92% and December 12, 2019 at 17.52%.
Apple Daily Time Frame Showing Overbought Zone
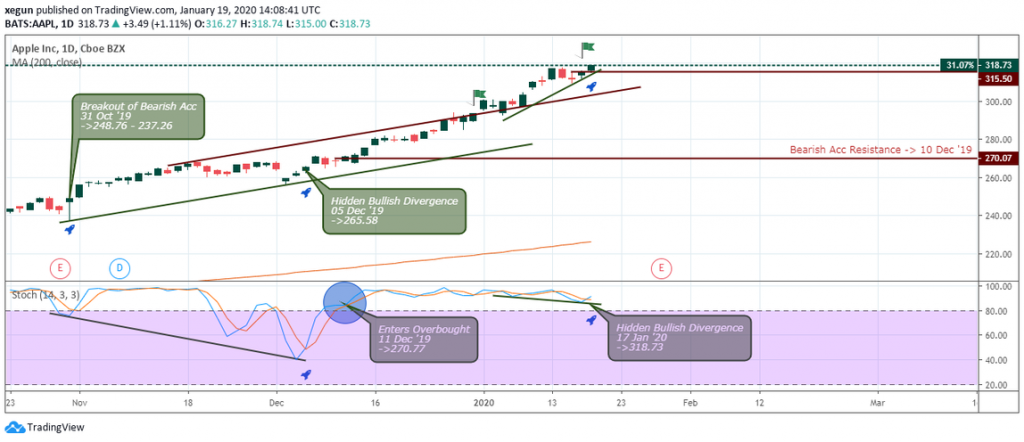
The second daily chart above shows the AAPL stock price in the overbought area. It signals a hidden bullish divergence chart pattern, in combination with a close above bearish accumulation resistance.
A close below the recent bullish divergence trend line on January 17, 2020 signals an exit of the bullish trend.
Analysis of Microsoft (MSFT) Stock Price
Microsoft Monthly Time Frame
The stock price of the MSFT bounced off the MA-200 while breaking the above bearish accumulation pattern at the same time.
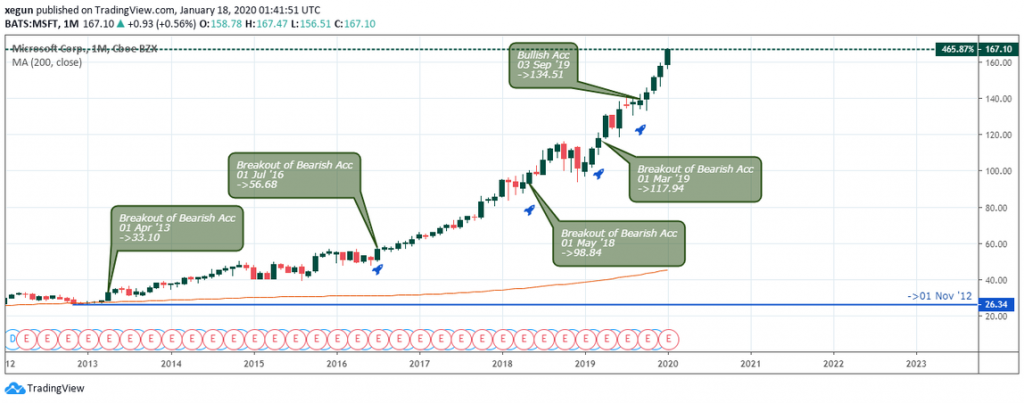
Going forward, all attempts by the bears to drive the price lower failed to increase demand for the MSFT stock on July 2016, May 2018, March 2019, and September 2019, respectively.
Microsoft Weekly Time Frame Showing Bullish Trend
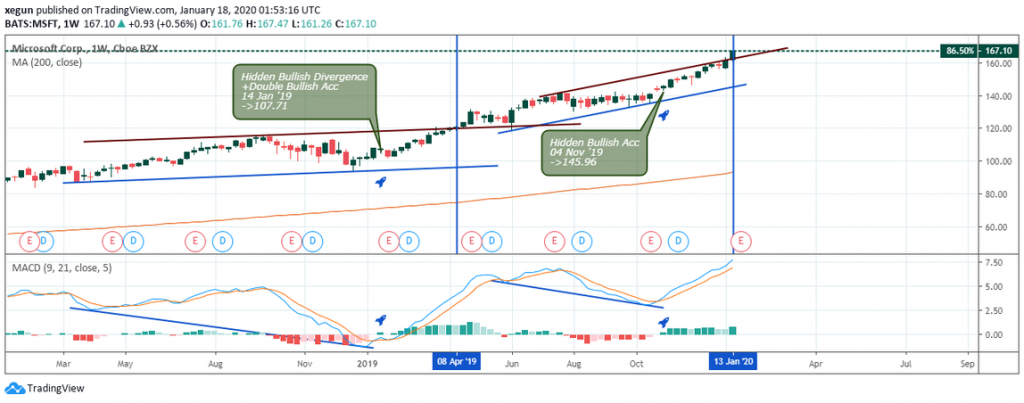
Hidden bullish divergence setups on the above weekly chart signaled a long entry into the long-term bullish trend.
A price close above the upper-bound resistance trend line (red) from the first hidden bullish divergence January 14, 2019, confirmed the increase in demand going forward.
The second upper-bound resistance trend line of the second hidden bullish divergence November 4, 2019 stresses an increase in volatility and opportunity to scale into the long position.
We can initiate a buy order on January 13, 2020; however, a close price back into the bullish divergence channel signals a drop in volatility, and we should exit the buy order.
Microsoft Weekly Time Frame Showing Overbought Zone
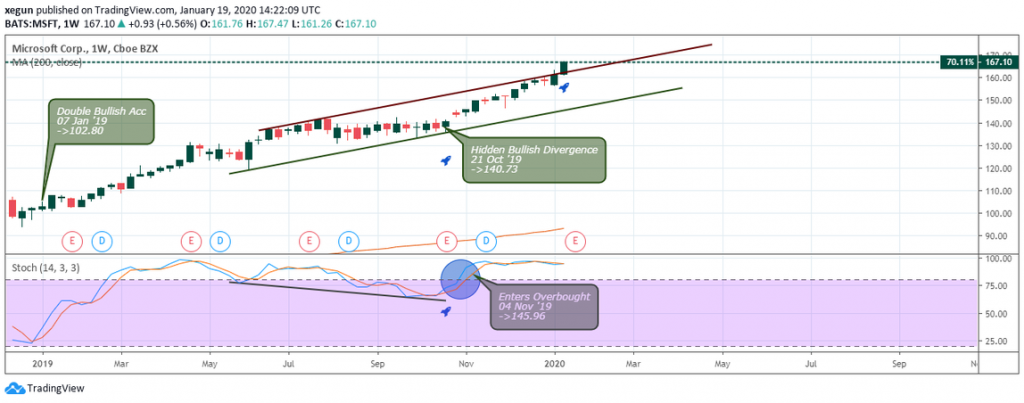
The stochastic oscillator also confirms the hidden bullish divergence while highlighting the overbought upbeat state of the stock price.
A close above the divergence upper-bound on January 13, 2019 resistance signals a buy order.
Conclusion
The above analysis shows that both the Apple (AAPL) and Microsoft Corp (MSFT) stock prices are in an overbought zone, which means we should be cautious while taking long entries.
To answer the question of which should you buy? Well, we suggest buying both, however, with more lot allocation to the MSFT stock compared to the AAPL price.
Disclaimer
Content provided by Crypto,Trader,News. is for informational purposes only, and should not be construed as legal, tax, investment, financial, or other advice. All information is of a general nature. As always, there is risk with any investment. In exchange for using our products and services, you agree not to hold Crypto,Trader,News. Pro, its affiliates, or any third party service provider liable for any possible claim for damages arising from decisions you make based on information made available to you through our services.
[/wlm_private]
Want to read the rest of the article? Join our pro-membership and receive all of the following:
✅Access to ALL content.
✅Access to the CTN editorial staff.
✅Access to our CTN trading dashboard.
✅Access to our exclusive telegram channel where all our pro-members and editorial staff are in.
✅Ability to request content/research material!