
Did you know that Litecoin halved in August 2019? Some analysts will say that the full impact of the halving is yet to be revealed; others attribute the bearish market sentiment to the halving as we all wait for the crypto markets to rebound, and then there are those who believe that the market corrected itself in anticipation of the August halving, which means the trade swings are based on speculation or mirroring Bitcoin’s market movement.
[wlm_private “Crypto Trader Pro – Monthly|Crypto Trader Pro – Yearly|Crypto Trader Pro (Lite)”]
Litecoin (LTC) is the number six cryptocurrency by market capitalization according to CoinMarketCap; a token that has shown great performance upon exiting the crypto winter of 2018. But through 2019, the LTC/USD pair has only corrected for the first and second quarter gains by a little below the 23.6% Fibonacci retracement level.
Let’s take a closer look at major events and technical trend drivers of the LTCUSD in 2019.
Litecoin Analysis
LTCUSD: Monthly Time Frame
From Q2 and Q4 of 2018, the pressure of bearish accumulation led to a sharp drop in the LTCUSD price if you’re looking at July 1, 2018 at $78.88.
Litecoin lost its value in price by about 68.37%.
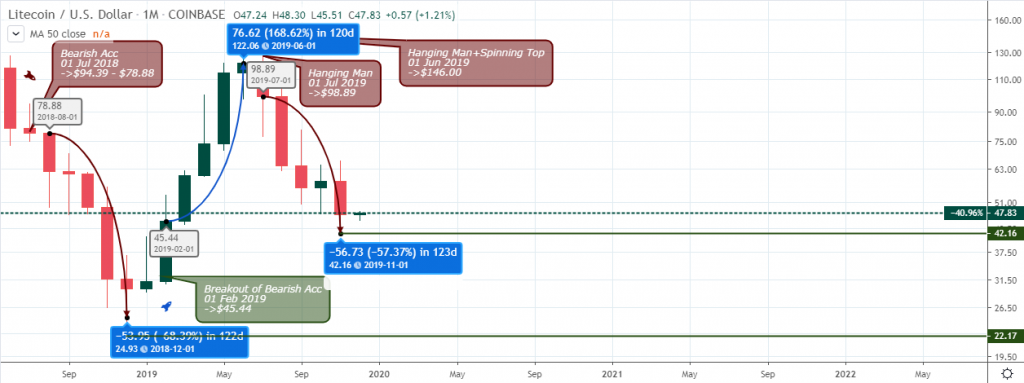
After the launch of the EFIN Token distribution on December 31, 2018, the price declined even further by -12.07% where LTC signaled a bearish accumulation pattern. From Q1 of 2019, LTCUSD increased in price, which was also fueled by the LTC coin event, Airbnb Vouchers, March 27, 2019 for an increase by +15.08%. The bulls showed strength with a breakup of bearish accumulation at the close of February’s candle at $45.44.
The second quarter continued with the bulls run with a win of upward momentum. At the end of the quarter, the candle closed at $122.06, an increase by 168.62%.
Q3 began with the entrance of bearish pressure. The month of July closed with a bearish engulfing candle at $98.89, signaling a reversal of an uptrend. The candlestick pattern indicated by the Hanging man and spinning top, gave the sign that the bears are taking the price down into the Q4 of 2019.
During the write up of this report, in this last month of Q4, the price found support at $42.12. The bearish momentum is down -57.37%.
LTCUSD: Daily Time Frame
The regular bullish divergence on December 10, 2018 at $25.24 indicates a MACD confirmation that gave rise to the price of LTCUSD. This move drew the attention of a more bullish trend to the upside. On February 1, 2019, hidden bullish divergence at $32.87 was in line with MACD; an entry point to go for a long position.
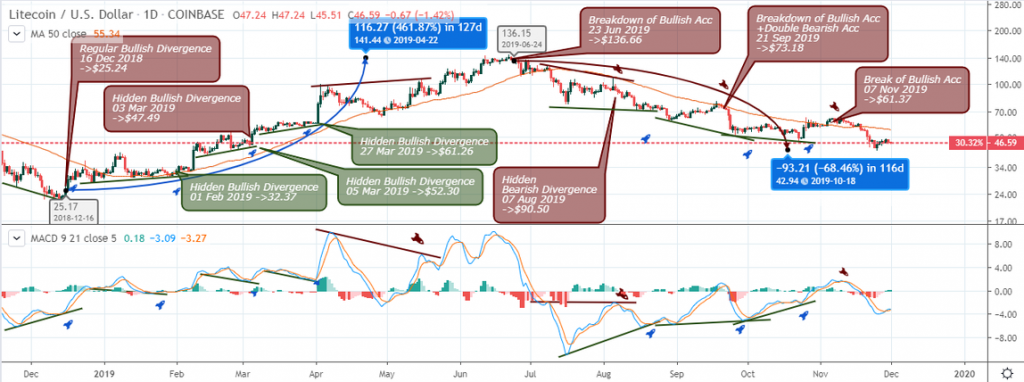
As of March 3, 2019, hidden bullish divergence was spotted at at $47.49 and just a couple days later on March 5, 2019, hidden bullish divergence was seen showing more buying pressure in the market.
March 25, 2019, hidden bullish divergence at $60.35 was also formed, which helped increase the price of LTCUSD. This indicated a strong uptrend with a price above MA-50.
The bull rally saw an increase of 461.87% in 127d.
When the price of Litecoin got to $136.15 on June 24, 2019, a breakdown of bullish accumulation took the price down and in the above chart, you can see our 50-MA is above price.
A hidden bearish divergence was sported on the August 7, 2019, giving more pressure to the downside. This move initialized following the block reward halving on August 6, 2019, for a price decline of about -18.15%.
There was a retest of the MA-50 and a breakdown of bullish accumulation with double bearish accumulation on September 21, 2019 at $73.18, which pushed the price of LTCUSD down by -68.46% to a low of $50.25. It led to a rise in price before another retest of the MA-50, which gave a break to the bullish accumulation on November 7, 2019 at $61.37, which led to the selling of LTCUSD.
The Bears and Bulls Scenario
Bullish Scenario
If the bulls can move the price of Litecoin above the 50-MA and sustain the pressure, we will most likely have an uptrend.
Bearish Scenario
If the pressure to the down side keeps pilling up and the 50-MA keeps acting as resistance anytime price touches it, then the sellers are still in control.
The key zone sellers are eyeing is the $42.32 price point. If it doesn’t break above soon, pressure toward the down side will increase as the price decreases in search of a new support level.
Disclaimer
Content provided by CryptoTraderNews is for informational purposes only, and should not be construed as legal, tax, investment, financial, or other advice. All information is of a general nature. As always, there is risk with any investment. In exchange for using our products and services, you agree not to hold CryptoTraderNews Pro, its affiliates, or any third party service provider liable for any possible claim for damages arising from decisions you make based on information made available to you through our services.
[/wlm_private]
Want to read the rest of the article? Join our pro-membership and receive all of the following:
✅Access to ALL content.
✅Access to the CTN editorial staff.
✅Access to our CTN trading dashboard.
✅Access to our exclusive telegram channel where all our pro-members and editorial staff are in.
✅Ability to request content/research material!
1 comment
[…] Litecoin […]
Comments are closed.