
Let’s take a look at Tesla stock and whether the trend indicates a correction or price movement in the up or down direction.
After a price slump below monthly bullish accumulation support on the monthly time frame of the Tesla (TSLA) price chart within BATS trading, the bulls launched an optimistic campaign on June 3, 2019, which consequently resulted in a 209.29% price hike.
[wlm_private “Crypto Trader Pro – Monthly|Crypto Trader Pro – Yearly|Crypto Trader Pro (Lite)”]
This sudden increase in price brings a lot of attention to the Tesla stock, which begs the question, will the Tesla stock correct itself soon?
Join us as we unveil the technical chart patterns that led to the current highs and possible bullish reversal signals, following a top-down analysis.
TSLA: Monthly Time Frame
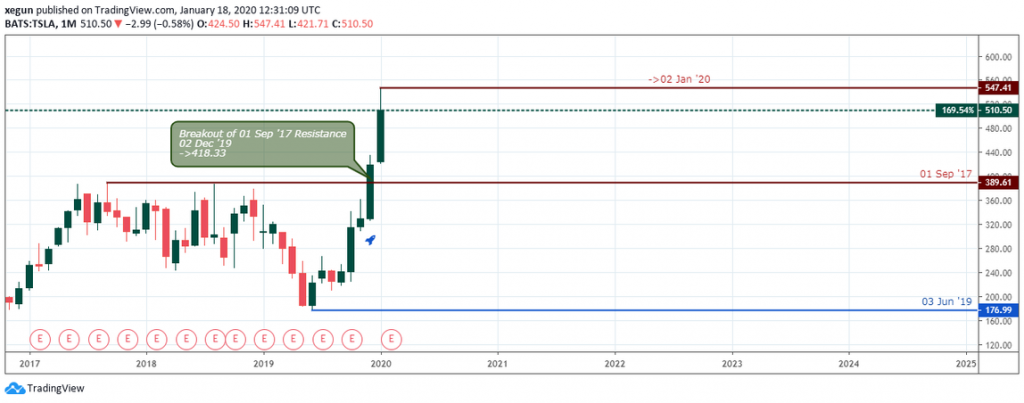
Tesla TSLA stock price from a monthly chart perspective bursts above a significant resistance level set up since September 2017, a move that confirmed an entry to enter a long position after a bullish accumulation pattern support (309.26) in November 2019.
TSLA: Weekly Time Frame
The weekly chart below shows the TSLA price chart up last week, signaling a shooting star candlestick pattern at the close, while failing to close above a Fibonacci extension level of 161.8% at 516.77, when considering September 18, 2017 swing-high to the June 3, 2019 swing-low.
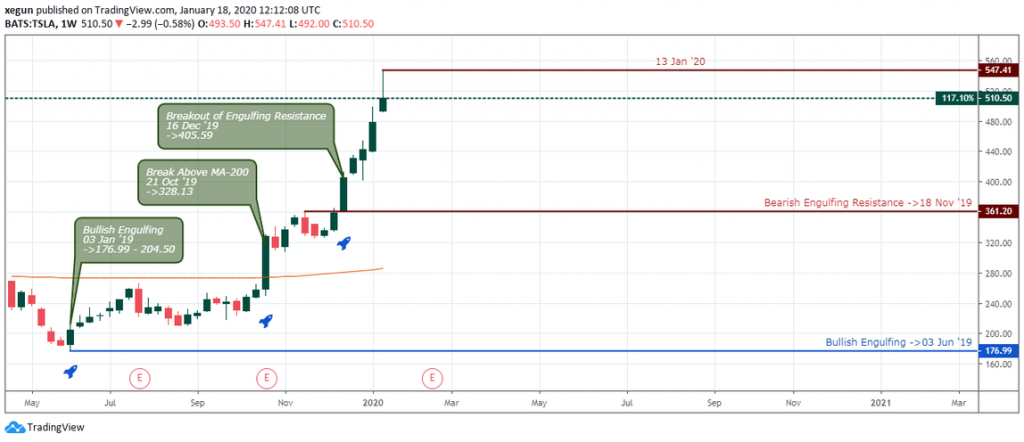
Entering into a long position from the current high can be likened to chasing the market a late entry, the reason being that the key entry points were after the bullish engulfing candlestick pattern on January 3, 2019, a close above the MA-200 on October 21, 2019, and breakout of engulfing resistance on December 16, 2019.
Let’s take one step lower to the daily time frame for a clear view of what is possible.
TSLA: Daily Time Frame
The hidden bullish divergence pattern signaled on December 10, 2019, was a valid entry point into the existing bullish trend that started from a price close above the 200-daily Moving Average.
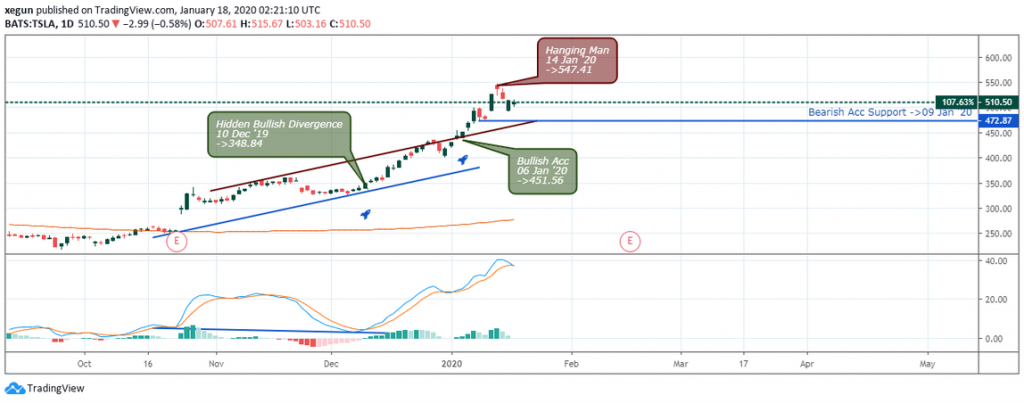
As the price trades above the upper-bound of the hidden bullish divergence channel, we get a confirmation of an overbought market structure. If the price close back into the channel and below the significant support at 472.87, we’ll view it as a decline in demand for Tesla shares.
However, if the support level holds the selling pressure, only then should we be on the lookout for bullish signals.
TSLA: 4-hour Time Frame
A view from the lowest time frame in our analysis, the 4-hour chart also signaled a hidden divergence pattern on January 2, 2020, and there is another one building up at press time.
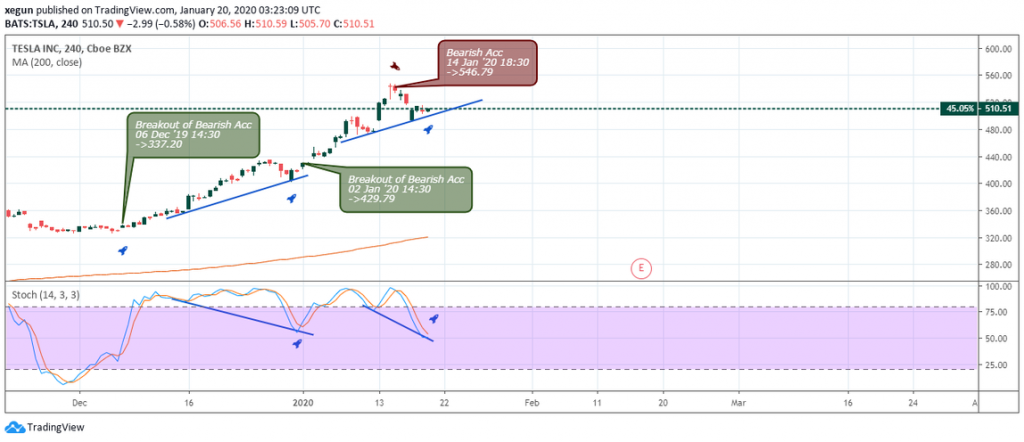
A golden cross of the stochastic oscillator would confirm a continuation of the bullish trend. However, if the price close below the recent trend bullish trend line, we should expect an extension of the bullish trend.
TSLA Conclusion
The current level of the price is excellent for taking profit, or perhaps closing a percentage of your open long positions. However, going long at this point will be a risky move, as the price now trades within the overbought zone.
A view from the daily chart below illustrates how the TSLA price came out of the oversold area on December 10, 2019, increased by 62.02% and currently flags a hanging-man candlestick pattern in combination with a regular bearish divergence pattern on January 16, 2020.
TSLA Daily Time Frame Showing Overbought and Oversold Zones
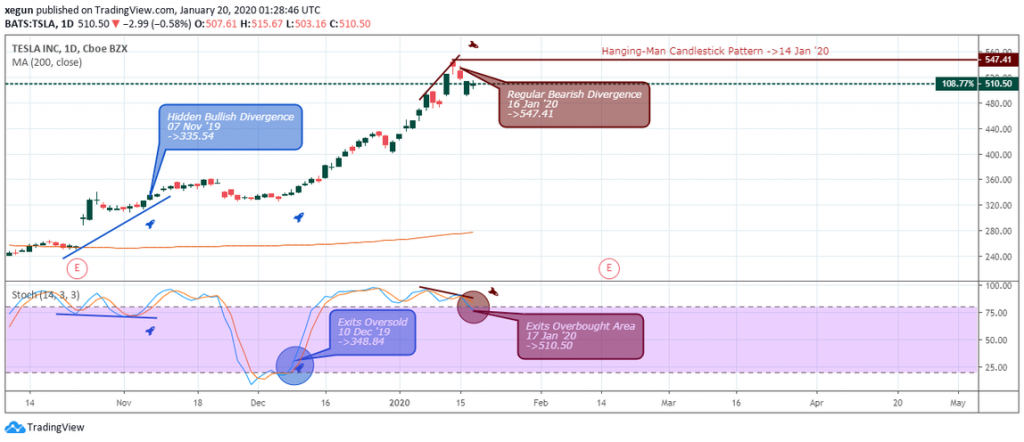
We’ll suggest staying on the sidelines for now, and only resume a buy order if the stochastic oscillator crosses back above the Level-80, with confirmation of a chart pattern such as a bullish divergence setup.
We believe the Tesla (TSLA) stock is set to correct its gains owing to volatility oversold signal, and other chart patterns analyzed above.
Disclaimer
Content provided by Crypto,Trader,News. is for informational purposes only, and should not be construed as legal, tax, investment, financial, or other advice. All information is of a general nature. As always, there is risk with any investment. In exchange for using our products and services, you agree not to hold Crypto,Trader,News. Pro, its affiliates, or any third party service provider liable for any possible claim for damages arising from decisions you make based on information made available to you through our services.
[/wlm_private]
Want to read the rest of the article? Join our pro-membership and receive all of the following:
✅Access to ALL content.
✅Access to the CTN editorial staff.
✅Access to our CTN trading dashboard.
✅Access to our exclusive telegram channel where all our pro-members and editorial staff are in.
✅Ability to request content/research material!