
If you’re into cryptocurrency and have a Twitter account, chances are you’ve been following MagicPoopCannon, a technical analyst and contributor on tradingview.com. Magic doesn’t pull any punches with expressing his opinion about the markets and he’s usually right. The latest Bitcoin analysis is indicating that there is strong bearish sentiment in the market but do we agree with his assessment?
[wlm_private “Crypto Trader Pro – Monthly|Crypto Trader Pro – Yearly|Crypto Trader Pro (Lite)”]
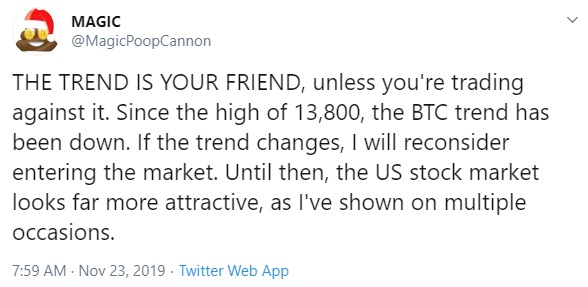
Many people are turning to the regular stock market where trading is strong and consumer confidence is high, as indicated by MagicPoopCannon’s recent tweet:
In a recent post, MacigPoopCannon analyzed the BTCUSD and pointed out his fears of an impending crash in the Bitcoin price towards $2K. He built his point using the famous Elliot wave analysis and established key levels.
In this post, we’ll dig deeper into some of the ideas he used in supporting his claims, throw more light on his Elliot wave analysis, and lastly reveal the primary fundamental driver of the Bitcoin price.
Bearish Scenario
Market Pair: BTCUSD Weekly Time Frame
By applying a logarithmic scale and establishing a logarithmic regression that accurately timed the peak and trough of the Elliot wave pattern, or Impulse wave, we can count the 1-2-3-4-5 impulse wave pattern and the current corrective A-B-C pattern.
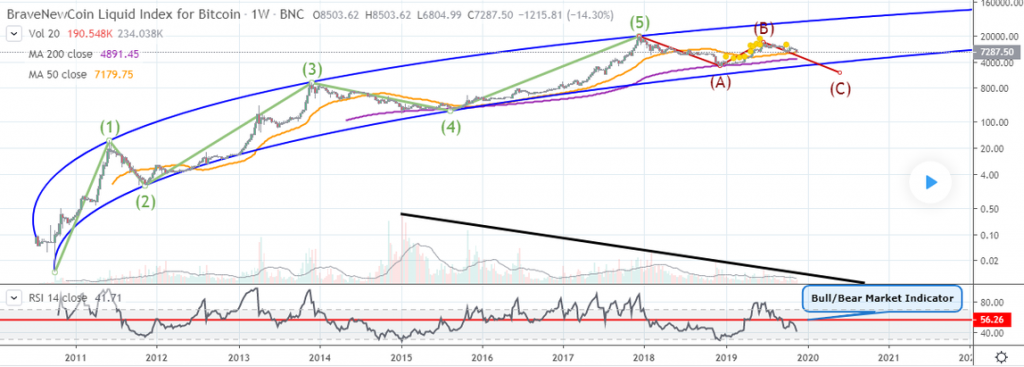
Following MagicPoopCannon’s analysis of the Elliot wave chart, the third wave is not the longest considering that he drew the lines from low to high, which we believe to be incorrect.
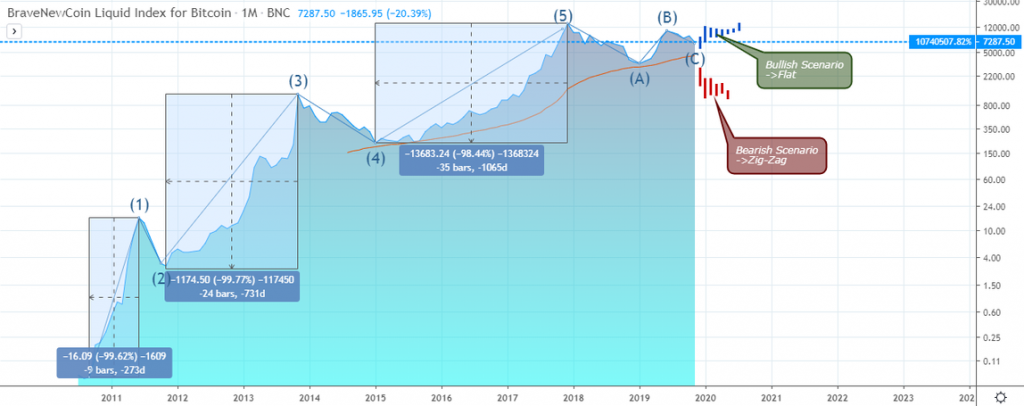
The monthly time frame chart below, still on a logarithmic scale, sets the Elliot wave pattern, considering only the closing price, where the wave three is the most extended wave in the sequence, a correct illustration of the Elliot wave sequence.
Bullish Scenario
Market Pair: BTCUSD Weekly Time Frame
Below is the correct illustration of the Elliot wave chart. Notice the Wave-3 is the most extended wave at 99.77%, followed by Wave-1 at 99.62%.
With that out of the way, let’s again consider his point that the December 2018 low was supposed to hit the logarithmic support, or blue line. That is not compulsory for a reversal as the fundamental driver for the Bitcoin price is the Miners reward chart, which we’ll later consider in this article.
There are two likely scenarios for the A-B-C pattern, which are flat and zigzag patterns; the charts below illustrate them. MagicPoopCannon suggests that the zigzag correction pattern indicates that the price may plummet below the 200 Weekly Moving Average (MA) before it bottoms.
Elliott Wave Corrective ZigZag Pattern
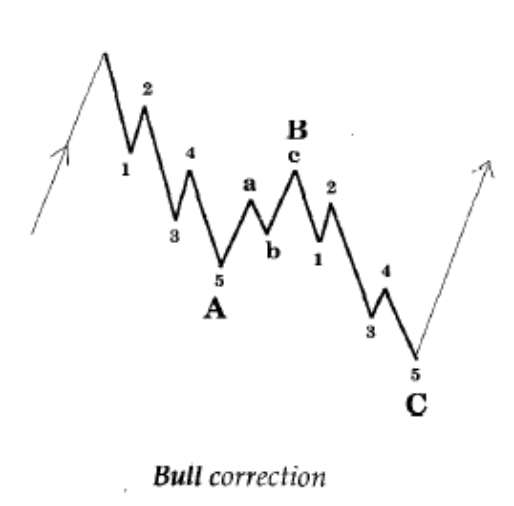
Elliot Wave Corrective Flat Pattern
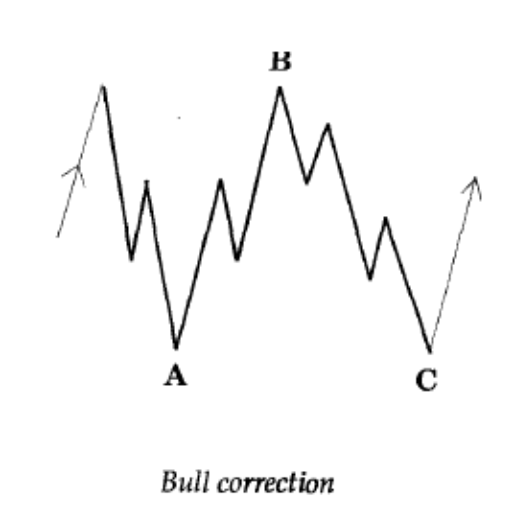
We agree with MagicPoopCannon on the idea of an A-B-C correction wave. However, the 200 Weekly MA may serve as an early bottoming of the current Wave-C. If that happens, we should not wait for the Bitcoin price to establish a classical FLAT or ZIGZAG pattern.
To confirm such an early scenario for a bottoming, we turn to the daily Point and Figure Chart and weekly candlestick charts of the Miners Reward for an understanding of the recent bear market and how it has predicted previous peaks and troughs.
Bitcoin Miners Reward Candlestick Chart: Daily Time Frame
The chart below illustrates how miners’ rewards has accurately timed the tops and bottoms of the BTCUSD since inception.
We’ll consider analyzing the Miners reward chart from a candlestick chart on the Weekly TF, and finally look at it from a Point and Figure chart on the daily time frame.
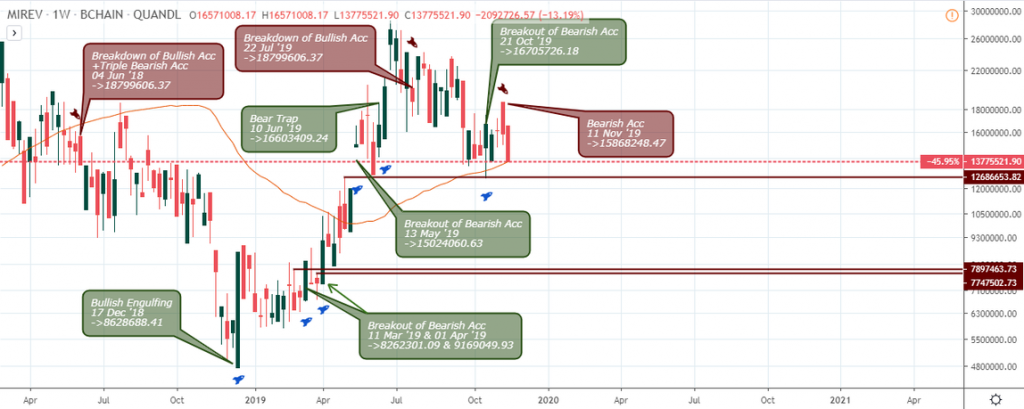
The weekly time frame of the Bitcoin miners reward turned bearish following a collapse of bullish accumulation support on July 22 ’19. The number one cryptocurrency by market cap has been in a bearish trend since.
A break above bearish accumulation resistance on October 21 brought a ray of hope to the BTC mining industry. However, it was dashed after another bearish accumulation pattern was flagged on November 11 ’19 sending BTC prices crashing down.
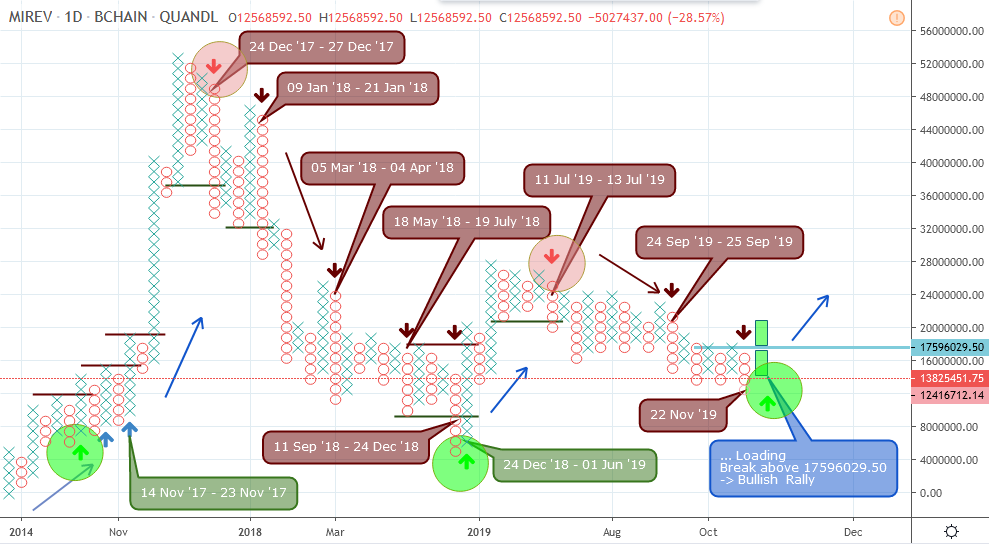
Next, we move on to analyze the BTC Miners Reward from a point and figure chart.
Bitcoin Miners Reward, Point and Figure Chart: Daily Time Frame
Viewing the BTC miners reward from a PnF chart, we are able to accurately time the reversal points of the Bitcoin BTC price.
The bearish trend started from July 11 & 13 ’19 after a collapse in miners reward. From that point on, the Bitcoin sentiment turned bearish.
Conclusion
To say that BTC prices will fall to $2K or lower is a bit exaggerated and a little too early, as mining rewards may improve, signaling a change in polarity from the current bear state to a bullish trend.
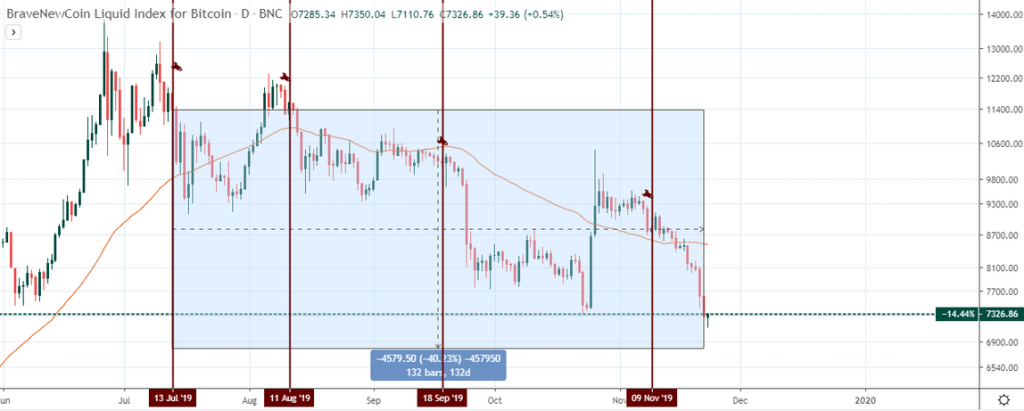
For now, the Bitcoin market is in a bearish trend according to our point and figure entry point on July 11 & 13 ’19 (BTC Miners Revenue), where it has traveled for 40.23% south.
We can look to enter new short positions from bearish price signals on the daily and weekly time frame of the BTCUSD for projected price target at $6500.
BTCUSD Bearish Entry Dates: Daily TF
A breakdown of the 50-week MA is possible at this point but note that the 50-week MA is also at a potential take-profit zone for bears, which is why we see a slowing of the price slumps.
It will be wise to stay on the sidelines for now until another collapse of bullish accumulation support or a double bearish accumulation pattern is signaled on the daily or weekly time frames.
As MagicPoopCannon stated in his tweet: “THE TREND IS YOUR FRIEND” – at least, until the bend at the end. Happy trading, all!
Disclaimer
Content provided by CryptoTraderNews is for informational purposes only, and should not be construed as legal, tax, investment, financial, or other advice. All information is of a general nature. As always, there is risk with any investment. In exchange for using our products and services, you agree not to hold CryptoTraderNews Pro, its affiliates, or any third party service provider liable for any possible claim for damages arising from decisions you make based on information made available to you through our services.
[/wlm_private]
Want to read the rest of the article? Join our pro-membership and receive all of the following:
✅Access to ALL content.
✅Access to the CTN editorial staff.
✅Access to our CTN trading dashboard.
✅Access to our exclusive telegram channel where all our pro-members and editorial staff are in.
✅Ability to request content/research material!