Following a prolonged correction phase of the BTCUSD from the second quarter of 2019 to date, traders and Bitcoin enthusiasts alike have been looking forward to an end to the price slump. This week, we’ll be analyzing the major catalysts and technical drivers of the Bitcoin BTC price, looking out for the possibility of a close above the $8000.00 round-number threshold.
[wlm_private “Crypto Trader Pro – Monthly|Crypto Trader Pro – Yearly|Crypto Trader Pro (Lite)”]
Bitcoin Miners’ Revenue
A view of the BTCUSD: Weekly Chart
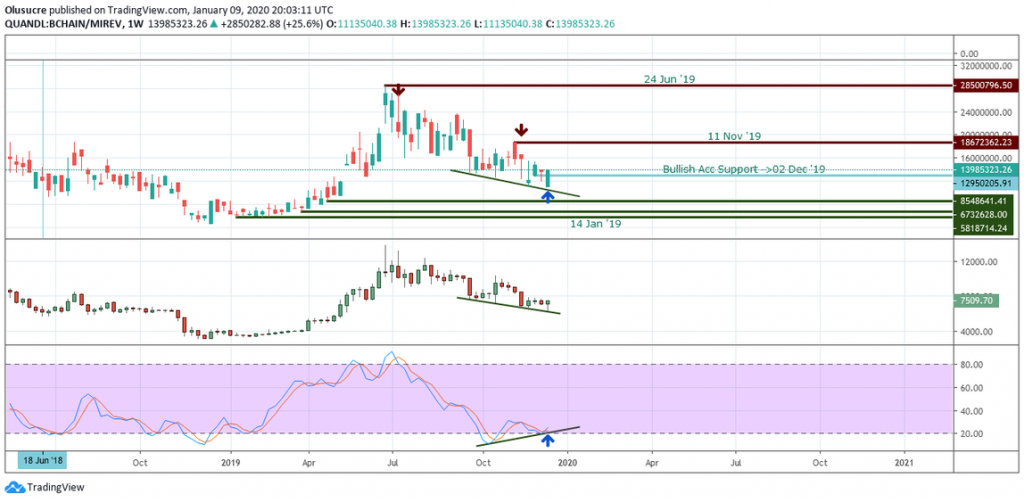
The miner’s revenue, or MIREV chart, from a weekly time horizon is a central driver of the Bitcoin price. The reason being that miners represent the central bank in a conventional fiat market function.

An expansion in miner’s revenue would incentivize miners to hold on to mined BTC but if miners’ income begins to dry up, they are no longer incentivized to hold on to their positions. This consequently leads to a bearish trend on the Bitcoin-to-Dollar chart.
After setting a high of 28.5B and signaling a collection of the bullish pattern on July 1, 2019, the miner’s revenue trended downward into a bearish drop for about 45.95% in 26 weeks.
The recent regular bullish divergence of the stochastic oscillator on the MIREV weekly chart reveals that we should anticipate a restoration in BTC price going forward into Q1-2020.
Let’s proceed to analyze the technical charts of the BTCUSD following a conventional top-down analysis.
BTCUSD: Weekly Chart
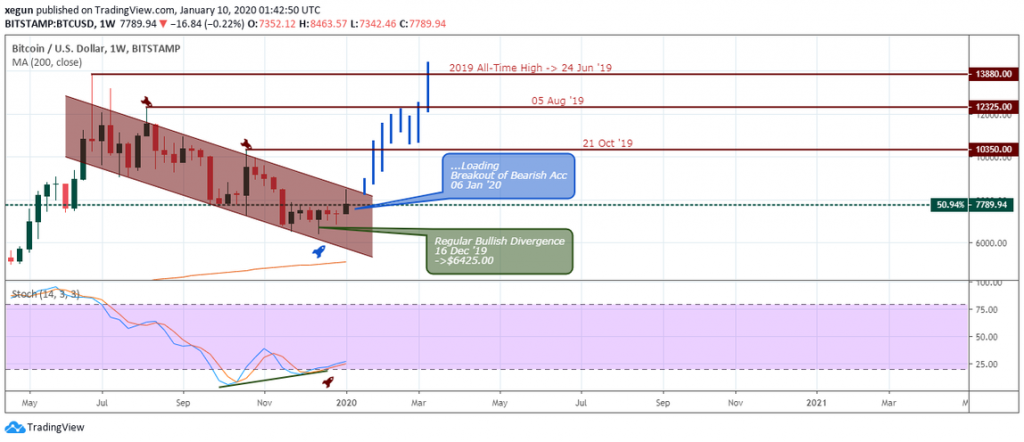
The weekly chart below for the BTCUSD price pair indicates that the BTC price is trading within a bearish channel, hitting the upper bound resistance on August 5, 2019, and October 21, 2019.

Notice the regular bullish divergence of the stochastic oscillator, signaled on December 16. If the Bitcoin price closes above the bearish accumulation resistance at $7,495, we should expect an established bullish campaign. Furthermore, a bullish price close above the bearish channel will signal an opportunity to scale into the impending bullish trend.
The market shows a strong bullish outlook on this time horizon, and it may mark an end to the six-month bearish price slump.
BTCUSD: Daily Chart

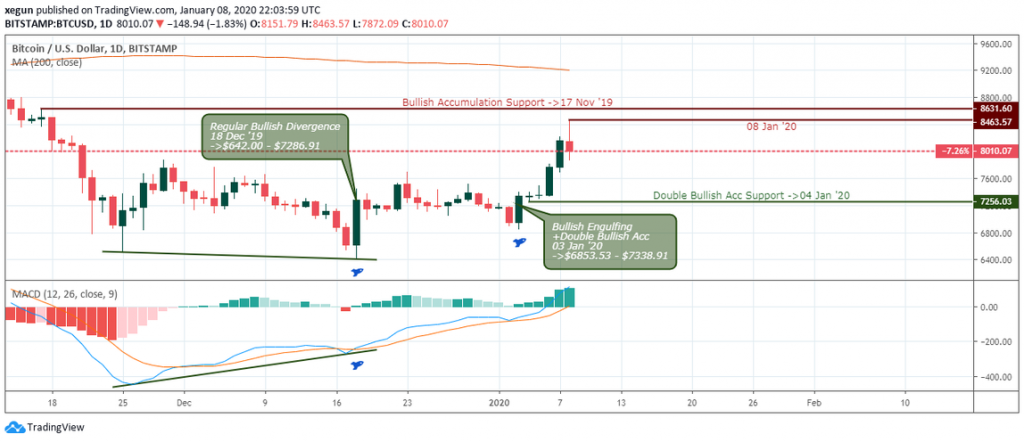
Just like the weekly chart overview, the daily time frame signals a regular bullish divergence. However, unlike the weekly time frame where a stochastic oscillator is used for the divergence pattern, here, the MACD indicator initiates the divergence threshold.
The divergence formation established a support level at $6,420, then later continued to flag a bullish engulfing and bullish accumulation pattern at $6,853.53 and $7,256.03 on January 3rd and 4th, 2020.
BTCUSD: 4-hour Chart
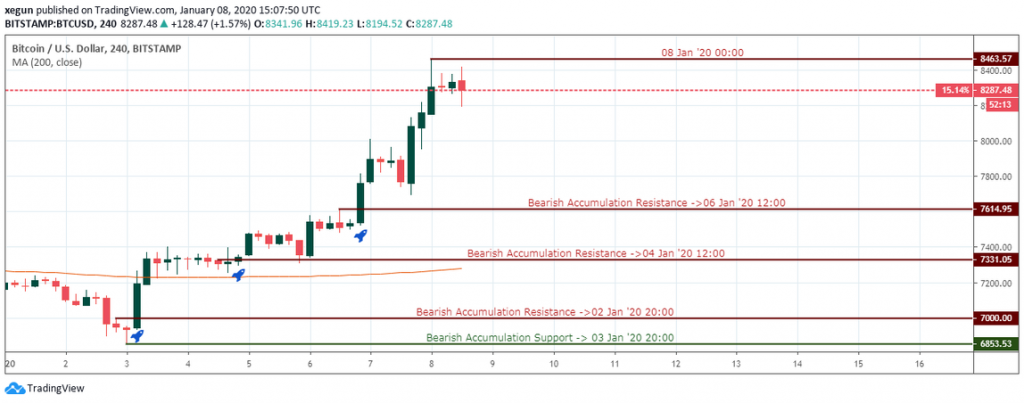
We are rounding up our analysis on the 4-hour chart, where the pair signals a breakout of resistance on January 3, 2020 at 04:00 for a price increase of about +17.7%.

After a hidden bullish accumulation pattern on January 8, 2020, hinting on possible exhaustion of the bullish trend, the BTCUSD price pair entered a correction phase for about 8% from the $8,463.57 resistance.
A bear-trap candlestick pattern flagged at press time January 10, 2020 at 08:00, shows a continuation of the price rally and increasing the chances of price closing above the $7,495 resistance and the $8K round-number resistance.
Bitcoin Projection
The above analysis shows that we should expect an end to the prolonged 2019 correction phase of the BTCUSD price pair if the analyzed resistance levels are breached, beginning with a price close above the $8K level in the next day or so.
Disclaimer
Content provided by Crypto,Trader,News. is for informational purposes only, and should not be construed as legal, tax, investment, financial, or other advice. All information is of a general nature. As always, there is risk with any investment. In exchange for using our products and services, you agree not to hold Crypto,Trader,News. Pro, its affiliates, or any third party service provider liable for any possible claim for damages arising from decisions you make based on information made available to you through our services.
[/wlm_private]
Want to read the rest of the article? Join our pro-membership and receive all of the following:
✅Access to ALL content.
✅Access to the CTN editorial staff.
✅Access to our CTN trading dashboard.
✅Access to our exclusive telegram channel where all our pro-members and editorial staff are in.
✅Ability to request content/research material!
