Is there panic in the cryptosphere as Bitcoin drops below the important $7K market support? What happened to the projections that Bitcoin would hit $15K or higher by year end? Are those predictions dead?
[wlm_private “Crypto Trader Pro – Monthly|Crypto Trader Pro – Yearly|Crypto Trader Pro (Lite)”]
On November 20, 2019, Alastair Marsh of Bloomberg hosted a three-person panel that spoke about Bitcoin in the context of Brexit, the geopolitical uncertainties, and trade wars. On the panel were Charles McGarraugh, Head of Markets at Blockchain.com; Travis Kling, Founder and CIO of Ikigai Asset Management, and John Pfeffer of Pfeffer Capital.
Starting the conversation, McGarraugh stressed the idea of Bitcoin proving itself as a hedge against uncertainties in recessions. John Pfeffer pointed out the notion of Bitcoin being “digital gold” and that it could be worth two times its current value. Kling made a more direct statement saying that investors speculating on Bitcoin being a store of value and an alternative after the United States dropped the gold standard.
Based on these statements, we do not foresee Bitcoin disappearing into oblivion. So, what’s going on?
In this post, we are analyzing the different trend scenarios and what to expect on the BTCUSD chart, as it drops below the $7K mark.
BTCUSD Weekly Time Frame
Bearish Scenario
Bulls that bought BTC after the October 25 break above bearish accumulation resistance of $8,531.25 are beginning to question the authenticity of the price break after a bearish inside-bar and bearish accumulation pattern formed on November 04.
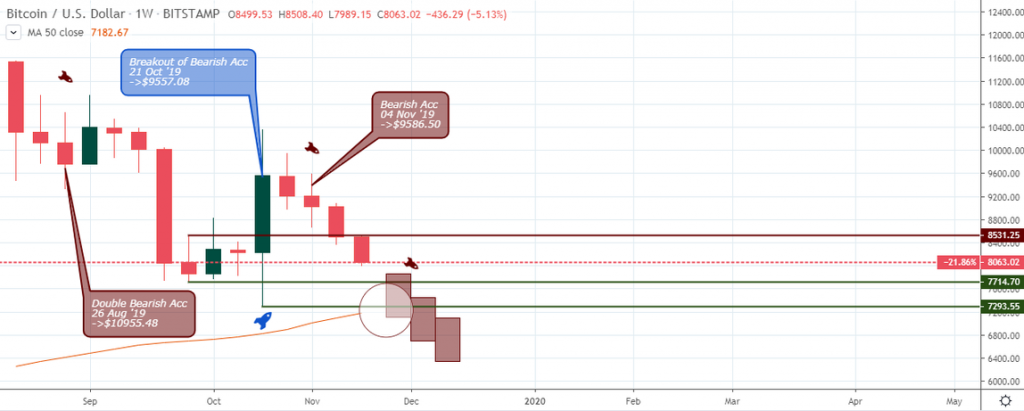
A break below the $7,293.55 support level should confirm a further plunge in the Bitcoin BTC price, as illustrated in the weekly chart above. The projected take profit and potential reversal point to the upside is the $5K mark.
BTCUSD Weekly Time Frame
Bullish Scenario
If BTCUSD fails to close below the $7,293.55 support, we may look forward to a reversal in the Bitcoin price to the upside.
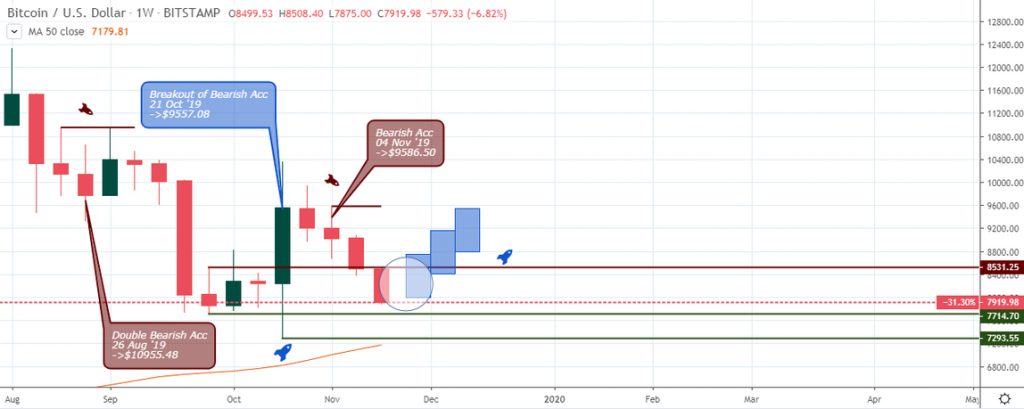
A break above the $8,531.25 support, now turned resistance, should confirm the decision to enter a long position.
BTCUSD Daily Time Frame
On November 20 ’19, the BTCUSD, from a daily chart, revealed an increase in sell orders in the form of double bearish accumulation and breakdown of bullish accumulation patterns.
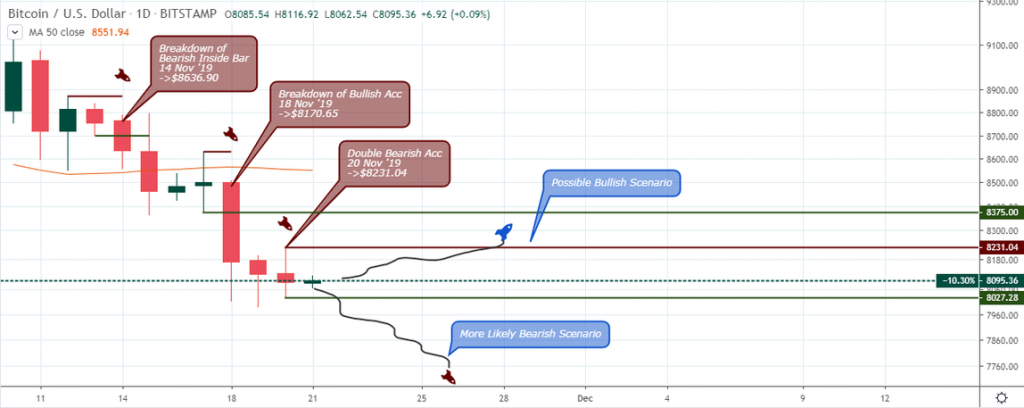
From that point, Bitcoin was set for another price slump, following the series of events, as shown above.
All hope for a surprise close above $8,231.04 by the bulls, to confirm a bottoming, was dashed as the price raced further south.
BTCUSD 4-hour Time Frame
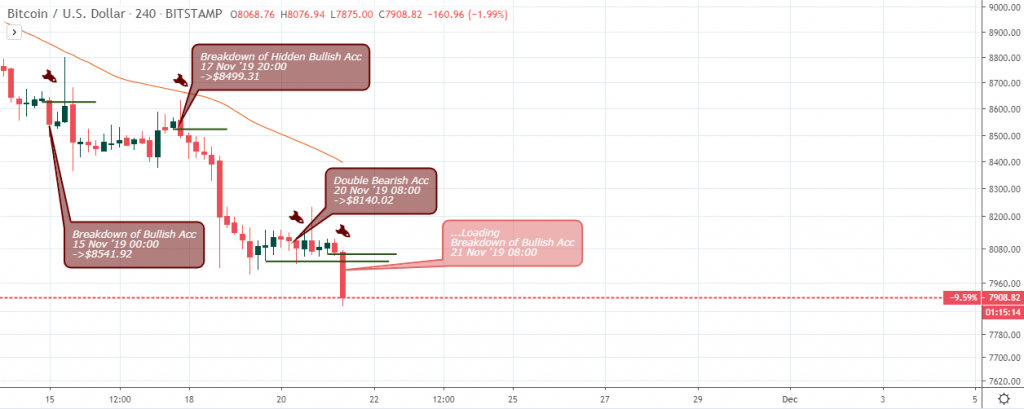
Coming down to the 4-hour time frame, we noticed how the bulls gave in to sell pressure on November 15, 00:00, 17 20:00, and 20 08:00, respectively.
But then, as we gathered the information for this article, the pair plunged deeper below the November 19 16:00 support and slumped further down as had been anticipated.
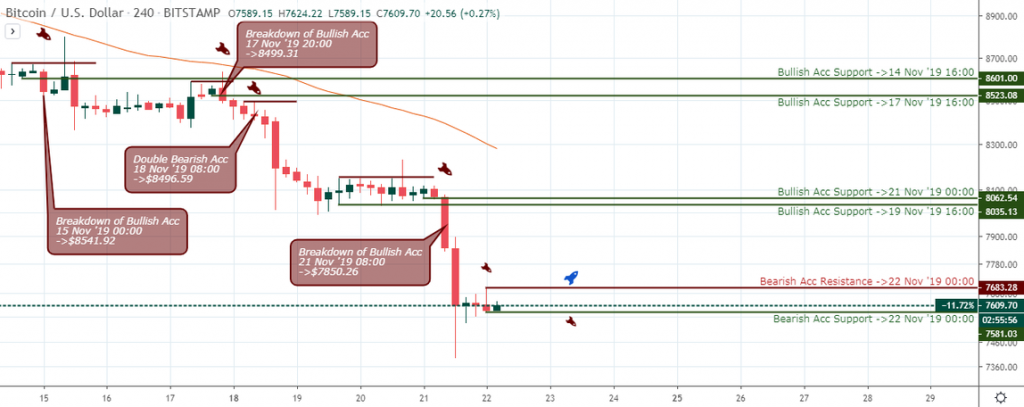
Above is an update to the 4-hour TF showing significant support levels that failed and the resistance levels that followed. Notice how the Bitcoin price failed to close above the resistance levels after each price break.
A close above $7,683.28 = Long, ELSE bears++.
Conclusion
Today November 22, at publication time, the price pierced through the $7K round-number support threatening to close below the $7,293.55 significant support level.
Update to the Daily Time Frame
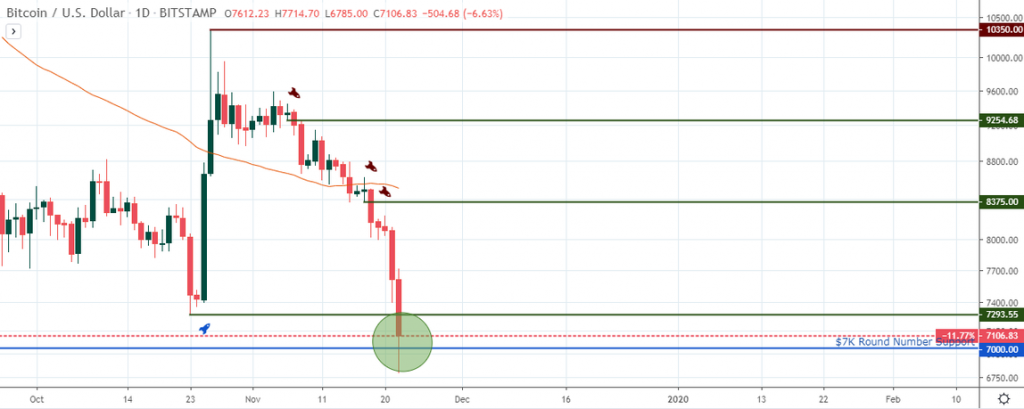
If the price closes below the $7106.83 level, we may see new lows in the coming weeks, unless a significant breakout of resistance is signaled over the weekend.
Finally, we round up by looking at the weekly chart of Bitcoin miners’ revenue.
The BTC miners’ revenue chart has accurately timed the crucial tops and bottoming of the Bitcoin price beginning with a bullish engulfing pattern on December 17, as shown below.
Bitcoin Miners Revenue: Weekly Time Frame
The bullish accumulation pattern on October 28 and breakout of bearish accumulation was rejected by selling pressure in the form of a bearish accumulation pattern last week, November 11, candlestick.
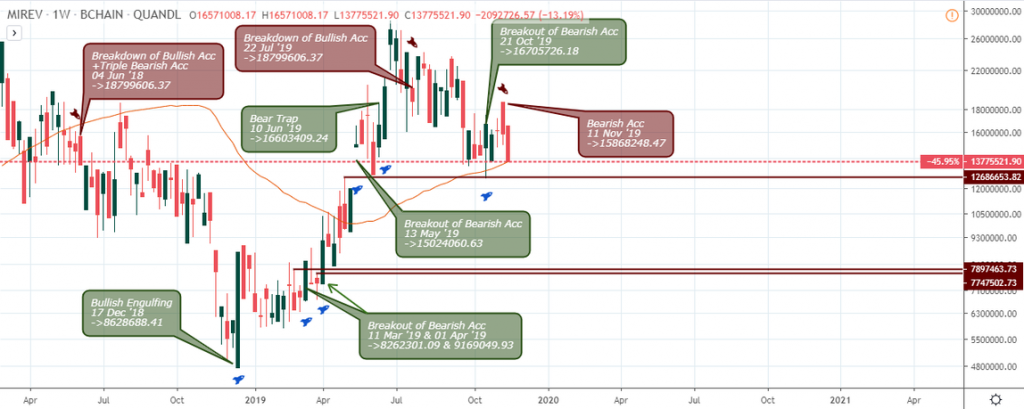
A breach of the October 21 support should reinforce selling pressure, sending the Bitcoin price towards the $5K to $4K range.
Disclaimer
Content provided by CryptoTraderNews is for informational purposes only, and should not be construed as legal, tax, investment, financial, or other advice. All information is of a general nature. As always, there is risk with any investment. In exchange for using our products and services, you agree not to hold CryptoTraderNews Pro, its affiliates, or any third party service provider liable for any possible claim for damages arising from decisions you make based on information made available to you through our services.
[/wlm_private]
Want to read the rest of the article? Join our pro-membership and receive all of the following:
✅Access to ALL content.
✅Access to the CTN editorial staff.
✅Access to our CTN trading dashboard.
✅Access to our exclusive telegram channel where all our pro-members and editorial staff are in.
✅Ability to request content/research material!
