Will Bitcoin ever repeat that amazing bull-run of 2017? While most people are more cautious and less vocal about those lambo dreams, there markets remain alive with a combination of volatility and hope. This article will be perusing Bitcoin market comparisons between Q4-2017 and Q4-2019.
[wlm_private “Crypto Trader Pro – Monthly|Crypto Trader Pro – Yearly|Crypto Trader Pro (Lite)”]
Despite the recent price correction of the BTCUSD in the last three months, many crypto analysts and enthusiasts liken the general price buildup in Q3-2019 to the same formation that led to the giant 2017 crypto rally.
One such enthusiast is Josh Rager, a notable Bitcoin bull, crypto trader, and analyst who, in a series of tweets, compared the recent Bitcoin price trend to the 2015/2016 price buildup that culminated into the bull run of 2017 of roughly 100%.
Rager believes that Bitcoin is about to repeat the same price pattern that led to the 2017 rally. We’re going over the the similarities and differences to see if we can corroborate Rager’s predictions with our own analysis of the technical drivers in both 2017 and 2019.
Bitcoin Q1 to Q3 2017
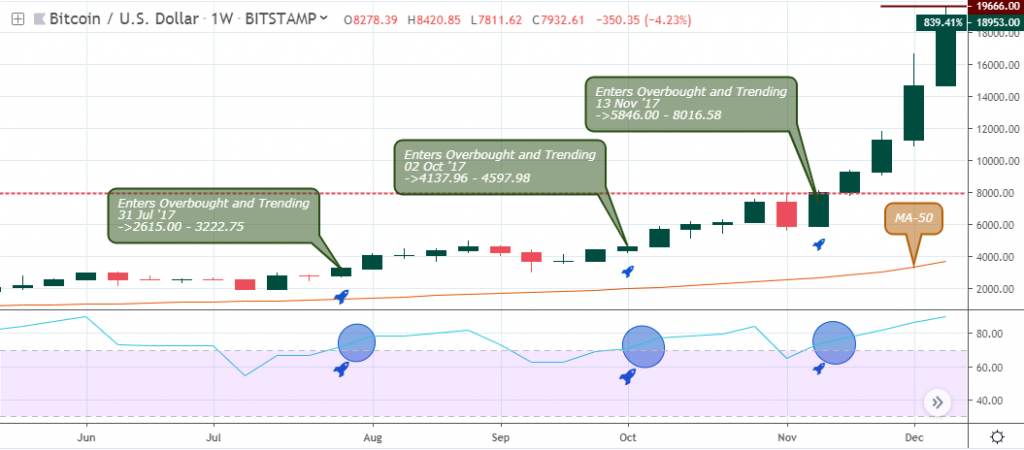
Let’s begin by considering the 2017 bullish rally. The number one cryptocurrency by market capitalization went bullish throughout 2017, closing at 11.21% in the first quarter, 131.47% in the second, 74.89% in the third quarter, and 226.28% in the fourth.
Similarly, BTCUSD has been closing bullish in 2019: 10.34% in Q1, 161.50% in Q2, and -23.0% in Q3. As we approach the middle of Q4, we’re observing an upward trend in the Bitcoin market.
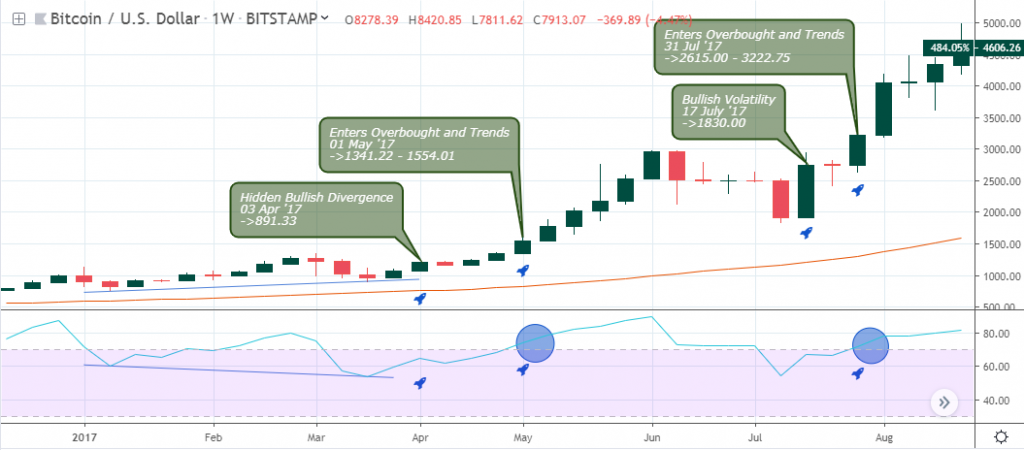
The Bitcoin price while closing bearish on March 06, 13, and 20, of 2017 still traded above the 50-period Moving Average, a general formation just like what’s going on now in Q4 2019.
A breakout of bearish accumulation resistance at $1,117.90 on April 03 ’17 in combination with a hidden bullish divergence pattern confirmed an end to the price correction, offered an opportunity to scale into the position on May 01, 2017.
The crypto pair completed a price rally of about 143.0% before making another correction towards the MA-50 on July 10, 2017, setting up another resistance level that got bashed.
Let’s proceed to visualize the critical patterns in 2019 and still probe deeper into similarities with 2017.
Bitcoin Q3 to Q4 2017
Bitcoin Q1 to Q4 2019
Upon exiting the prolonged crypto winter of 2018, BTCUSD entered the overbought area on May 06, 2019, while at the same time closing above the MA-50 level.
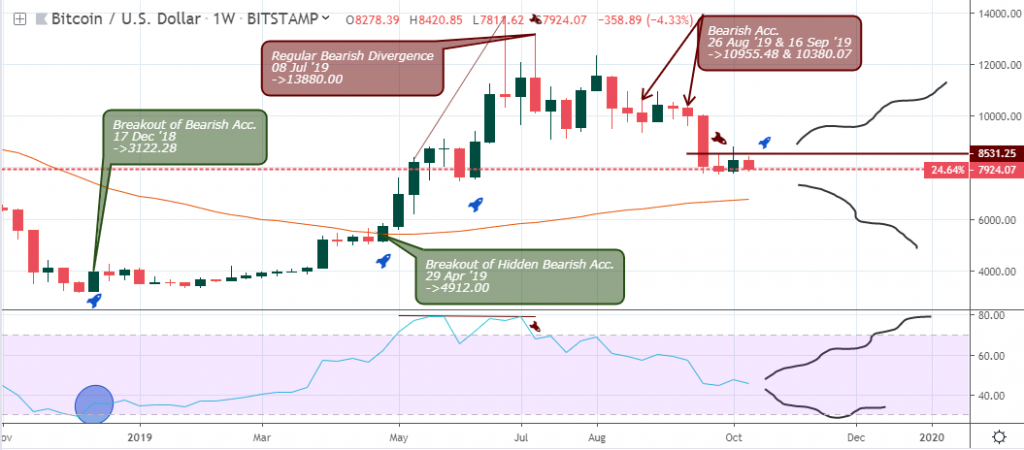
This is the first break above the 50-period Moving Average, and the recent price correction is still a decent move, one not too huge to cause a panic for Bitcoin HODLers.
A price close above the $8,531.25 resistance level will confirm an end to the price correction and a highly probable continuation of the bullish trend. However, if the weekly price close below the MA-50, we may be looking at the complete switch from a bullish to bearish sentiment.
Price Model 2014 to Present
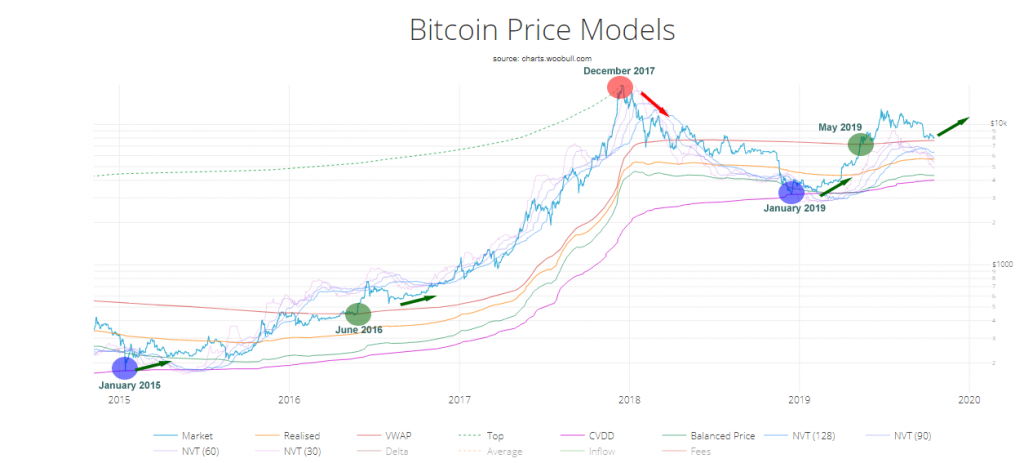
Chart source: woobull.com
The above chart covers the price movement of BTC from November 2014 to the present day. It lends an excellent overview and shows the likelihood of a continuation that’s similar to 2017.
The Magenta Line
Following the magenta line on the woobull chart, the experimental Cumulative Value Days Destroyed (CVDD) historically timed the bottom of the Bitcoin market. The first was in November 2011, followed by January 2015, and a more recent bottoming in January 2019.
As coins move from old to new investors, the transaction carries a USD value and also destroys an amount of HODL time by the previous holder.
According to Willy Woo analysis, CVDD “is the cumulative sum of this value-time destruction as a ratio to the age of the market and divided by 6 million as a calibration factor.“
Volume Weight Average PRICE
Another indicator is the Volume Weight Average of Price (VWAP). It is an approximation of what the entire market paid for their coins using market price and on-chain volume.
It has also historically timed a continuation of a long term bull run after a significant bottoming on the CVDD.
The first historical move was in August 2012, followed by June 2016, and the recent was in May 2019. With that said, we realized that an early cross above the VWAP price ignited the crypto rush of 2017. A similar chart formation is already building up, and we may see a strong bullish impulse wave headed towards the $20K mark as the year comes to a close.
Conclusion
To wrap up the analysis, Kain Warwick, Chief Executive at Blueshyft, a payment processing service company in Australia, emphasized an increase in daily Bitcoin volume following the exit of the 2018 crypto winter. He compared this year’s early price surge to the events that led to the 2017 Bitcoin Bull Run. With that said, we believe that the current price correction is simply a correction wave in an Elliott wave chart structure.
In essence, if the price patterns and indicators continue as they have been, even with volatility and despite world news, we are seeing significant market comparisons between Q4-2017 and present day analysis to predict a bull run is on the horizon.
Disclaimer
Content provided by CryptoTraderNews is for informational purposes only, and should not be construed as legal, tax, investment, financial, or other advice. All information is of a general nature. As always, there is risk with any investment. In exchange for using our products and services, you agree not to hold CryptoTraderNews Pro, its affiliates, or any third party service provider liable for any possible claim for damages arising from decisions you make based on information made available to you through our services.
[/wlm_private]
Want to read the rest of the article? Join our pro-membership and receive all of the following:
✅Access to ALL content.
✅Access to the CTN editorial staff.
✅Access to our CTN trading dashboard.
✅Access to our exclusive telegram channel where all our pro-members and editorial staff are in.
✅Ability to request content/research material!