
The $10K round number has been a significant price level across different time frames on the Bitcoin (BTC) chart against the USD.
[wlm_private “Crypto Trader Pro – Monthly|Crypto Trader Pro – Yearly|Crypto Trader Pro (Lite)”]
Following a failure to attain the $11K level on August 19, BTC prices fell below the $10K threshold at press time, totaling about 9% after the hanging man candlestick pattern on August 20.
The Bitcoin price has broken through and bounced off and resisted from further increase by the crucial $10K level since January ’18.
In this post, we analyze the price dynamics of the Bitcoin price around the $10K round number by following a top-down analysis of BTCUSD.
Monthly Time Frame
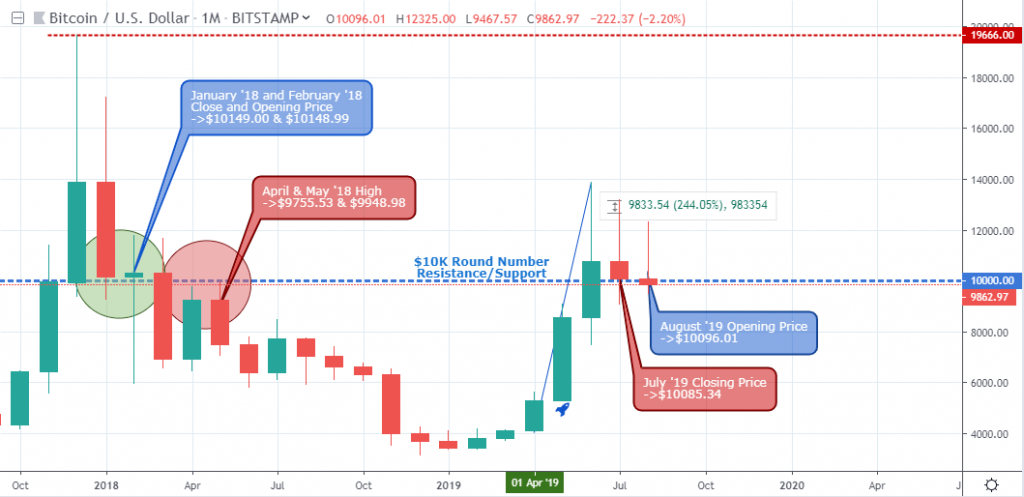
Starting with the monthly time frame, and at the end of the cryptocurrency rush of 2017, BTC prices traded above the $10K level on January and February ’18 before finally closing below the level on March ’18.
Considering the intensity of the bearish price drop in March ’18, the price rebound upwards where the $10K level served as resistance due to a polarity switch from the breakdown.
The price close below the bearish inside bar of March 01 ’18 confirmed crypto winter with roughly a 48.8% decline from the breakdown point.
A breakout of double bearish accumulation on April ’19 confirmed an exit of the crypto winter which sent Bitcoin prices racing above the $10K round number resistance, which serves as a support as a result of the price breach.
After the price close above the $10K resistance, the following month July ’19 closed bearish at 100085.34, a value slightly above the $10k level.
The current outlook of the Bitcoin $10K level from the monthly time frame is a support level.
BTCUSD Daily
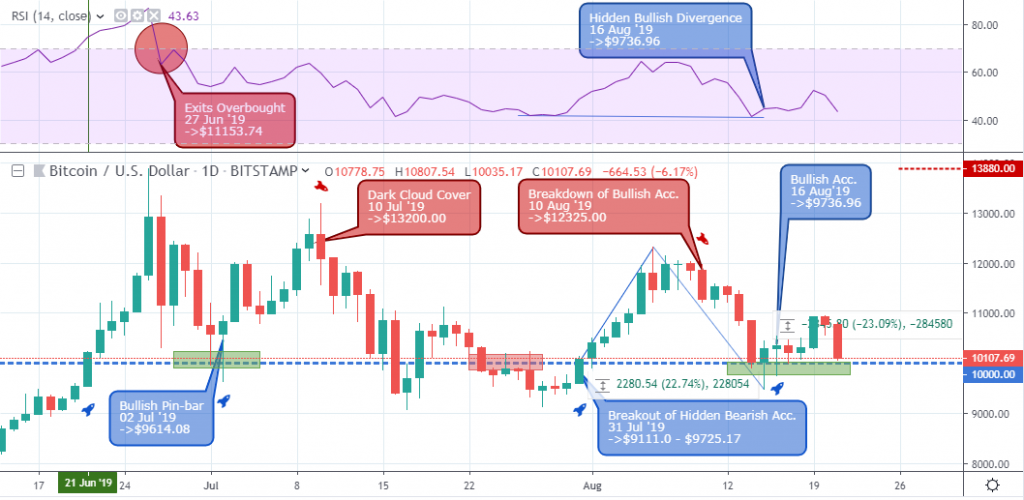
Coming down to the daily time frame, the BTC price breaks above the $10K reference level and enters the RSI overbought territory on June 21 ’19.
Upon exiting the overbought area later on June 27 ’19, the increase in selling pressure pushed the price south where the $10K level serves as support on July 02, forming a bullish pin-bar candlestick pattern.
After breaking below the $10K level on July 23, the Bitcoin price used the level as resistance on July 25 and 27 before a break above the $10K resistance on July 31, an increase of 22.6%.
Not too long ago, on August 14, the $10K level served as support, where the price signaled a bullish accumulation pattern on August 16 ’19, for a price growth that was cut short after a hanging man candlestick pattern on August 20 ’19.
On August 21, the Bitcoin price established a daily low at $9853.45, then closed at $10134.75 above the $10K round-number support.
A bullish reversal pattern signaled at the current level, pose an increase in demand for the BTC. A bearish pattern, on the other hand, may show a continuation of the bearish price descent.
BTCUSD 4-hour
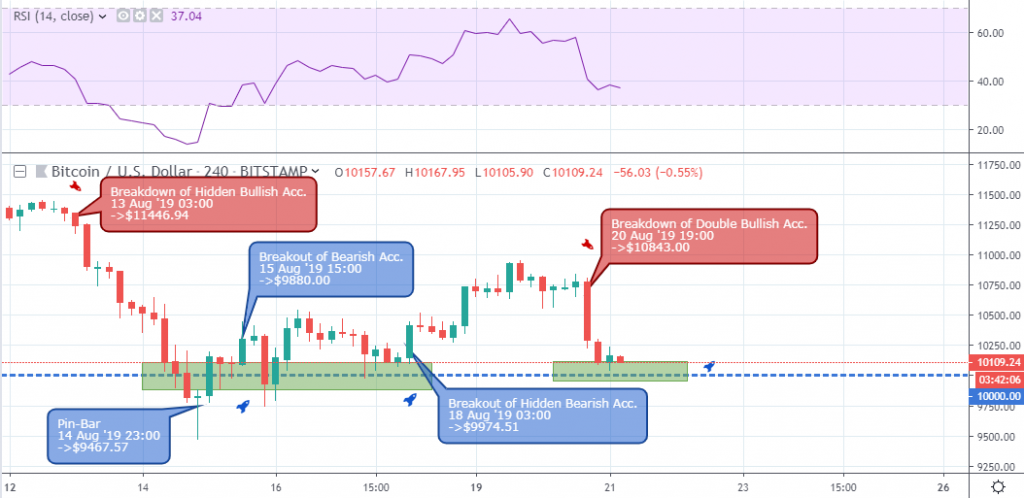
An overview from the 4-hour time frame again shows the Bitcoin price hovering above the $10K level after first breaking below it on August 14 ’19.
The support level established at $9880 propped the BTC price above $10K with trading above the level for another five days before the price closed below it on August 21 ’19 07:00. At press time, BTC price trades were below the $10K price level showing neutral signals.
Conclusion
As Bitcoin dominance increased over the past few months, and with the BTC network hash rate breaking record highs, the current price decline below the $10K zone is still believed to be an excellent price point to scoop up some BTC.
The head of OTC trading at Kraken stated an increase about 20 fold in OTC transactions since 2018, which is considered quite bullish for the number one cryptocurrency.
Disclaimer
Content provided by CryptoTraderNews is for informational purposes only, and should not be construed as legal, tax, investment, financial, or other advice. All information is of a general nature. As always, there is risk with any investment. In exchange for using our products and services, you agree not to hold CryptoTraderNews Pro, its affiliates, or any third party service provider liable for any possible claim for damages arising from decisions you make based on information made available to you through our services.
[/wlm_private]
Want to read the rest of the article? Join our pro-membership and receive all of the following:
✅Access to ALL content.
✅Access to the CTN editorial staff.
✅Access to our CTN trading dashboard.
✅Access to our exclusive telegram channel where all our pro-members and editorial staff are in.
✅Ability to request content/research material!