
What the heck is going on with the crypto markets – and more importantly, are there any safe places to put our money? Well, if you’re a cryptopreneur then you already know that the markets are fickle and they’ll plunge for no apparent rhyme or reason, or rocket to bullish sentiment. Despite the volatility, we want to focus on five popular altcoins that you might want to investigate.
[wlm_private “Crypto Trader Pro – Monthly|Crypto Trader Pro – Yearly|Crypto Trader Pro (Lite)”]
Being a month away from what we’re reviewing, it’s important to make note of any trends between the then and now. In October, the cryptocurrency markets experienced slower price growth following an apparent overbought sentiment on October 21 ’19.
Changpeng Zhao Binance CEO, in a recent tweet, highlights his optimism toward a continuation of the Bitcoin BTC price rally to $16K soon.
CZ’s suggested bottoming of the market correction is a long term overview on the weekly to monthly time frames and should not be considered as short term intraday entries.
Another interesting fact is that Bitcoin, since 2003 and from a long-term price action viewpoint, has continued to outperform the S&P 500.
What can we see from the October 21, ’19 signs of recovery in the top-performing crypto pairs? Compare last month’s charts to see if this is the start of a new bullish cycle, or if we’ve been in a continuous, yet volatile decline.
Here are October’s price charts.
Market Pair ATOM/USD: Weekly Time Frame
At number one position is the Cosmos ATOM altcoin. ATOM paired against the USD on Kraken exchange made an increase of about 122.50% from a September 01 ’19 low and set a new high in November ’19.
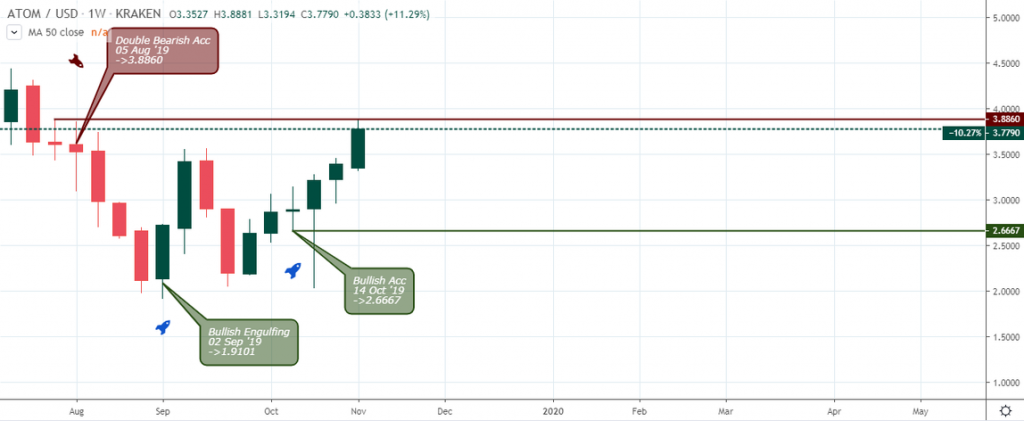
The trend buildup was initialized after a bullish accumulation pattern on October 14, where the ATOMUSD pair established a support level at $2.6667. From that point, the pair signaled a bullish engulfing pattern the next week surging to a new high of 4.250 on November 04 ’19.
At the time of writing this, the ATOM/USD market pair is trading at $3.3338 according to Kraken Exchange.
Market Pair ATOM/USD: Daily Time Frame
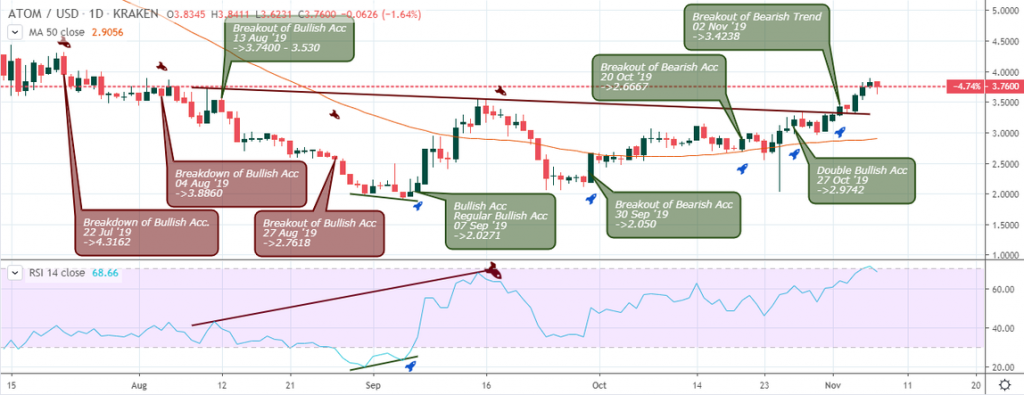
A view from the daily time frame reveals a series of breakouts of resistance levels on September 07, September 30, October 20, October 27, and the breakout of the bearish divergence trend line on November 02.
Market Pair XLM/USD Weekly Time Frame
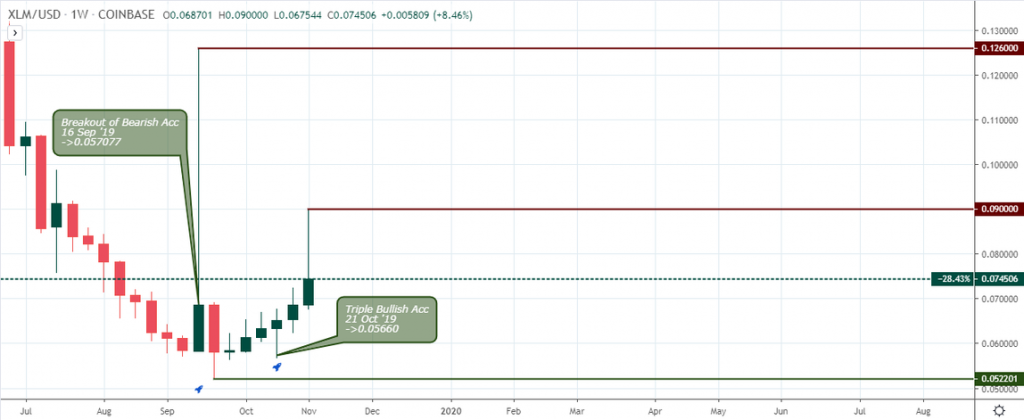
Stellar (XLM) to USD spiked by 116.83% above bearish accumulation resistance 0.061721 from its September 16 open price. The price surge later settled as the pair closed, forming a long upper shadow and then transitioned into a series of bullish closing candles, or triple bullish accumulation for a price increase of 72.41%.
At the time of writing this, the XLM/USD market pair is trading at $0.063926 according to Kraken Exchange.
Market Pair BNB/USD: Weekly Time Frame
Binance Coin (BNB) price increased by 55.99% from the September 23 ’19 low, and signals series of bullish accumulation patterns that followed a breakout of bearish accumulation resistance $16.3834125.
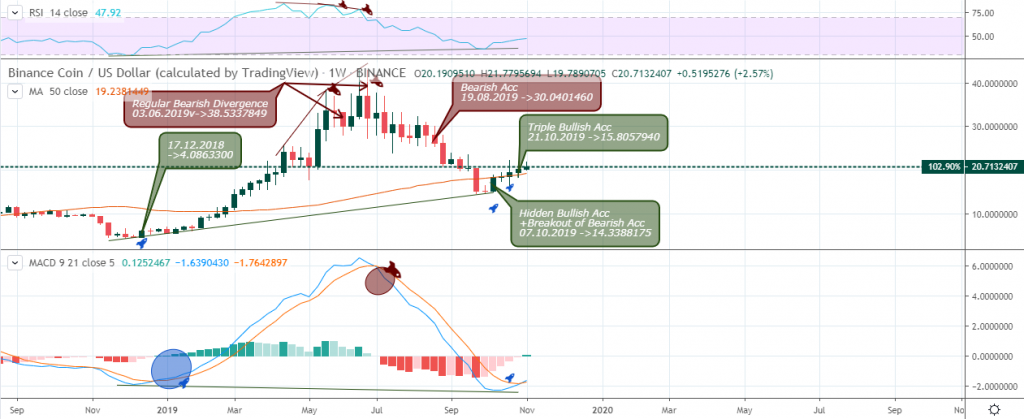
If the bears fail to force the price below $15.8057940, we should look forward to a surge in the price of the Binance Coin into the end of Q4 ’19.
At the time of writing this, the BNB/USD market pair is trading at $17.83 according to Binance Exchange.
Market Pair BTC/USD: Weekly Time Frame
Bitcoin (BTC) broke out of the significant bearish accumulation resistance on October 21 ’19, confirming an end to the price correction for a total 41.91% increase in the last four weeks.
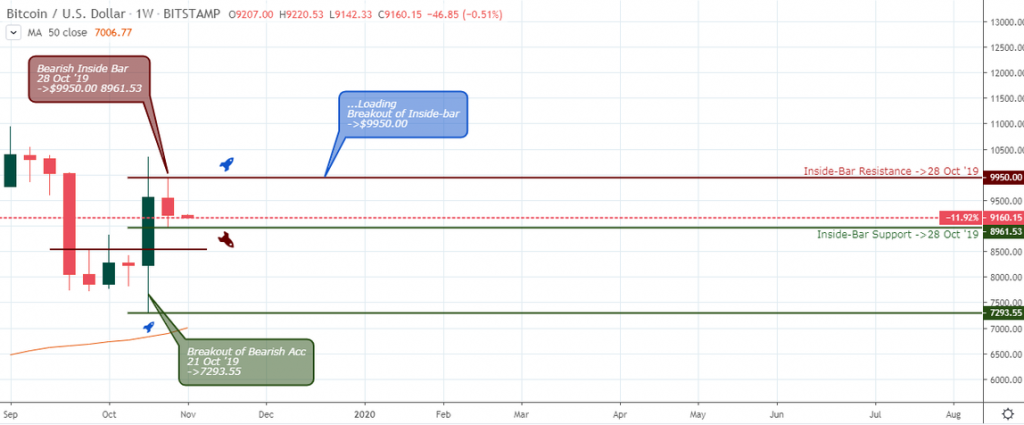
Although the pair signals a bearish inside-bar on October 28 ’19, the earlier bullish engulfing candlestick pattern shows that the bulls still maintain a stronghold on the BTC upward price direction.
At the time of writing this, the BTC/USD market pair is trading at $8,070.9 according to Kraken Exchange.
Market Pair HT/USD: Weekly Time Frame
Huobi Coin (HT) signals a hidden bullish divergence pattern as the RSI forms a lower low compared to the higher low of the price chart.
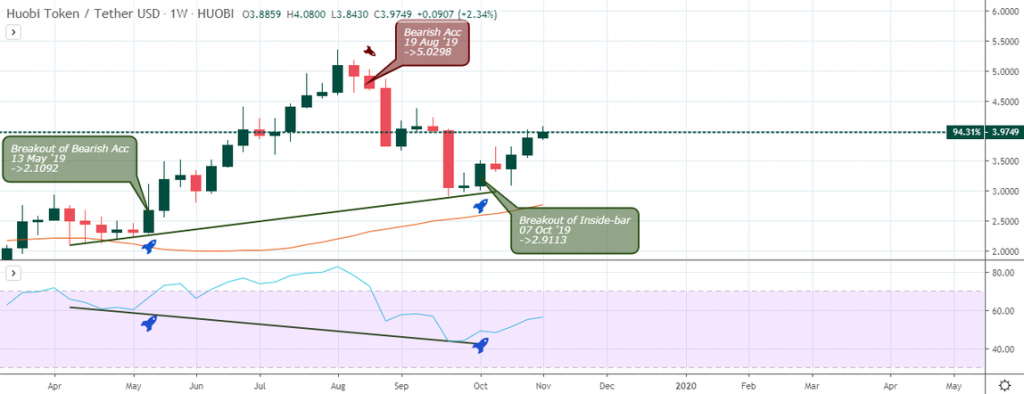
The pair now head towards the RSI overbought area after bouncing off the MA-50 support zone and has so far increased by 40.14% from the September 23 low. We look forward to a similar increase in the price similar to that of March 13 ’19 (153.68%).
At the time of writing this, the HT/USDT market pair is trading at $3.3461 according to Bitmart.com.
Market Pair HT/USD Daily Time Frame
A daily chart overview of the Huobi Coin reveals a break out of the October 16 bearish divergence trend line on October 27 ’19.
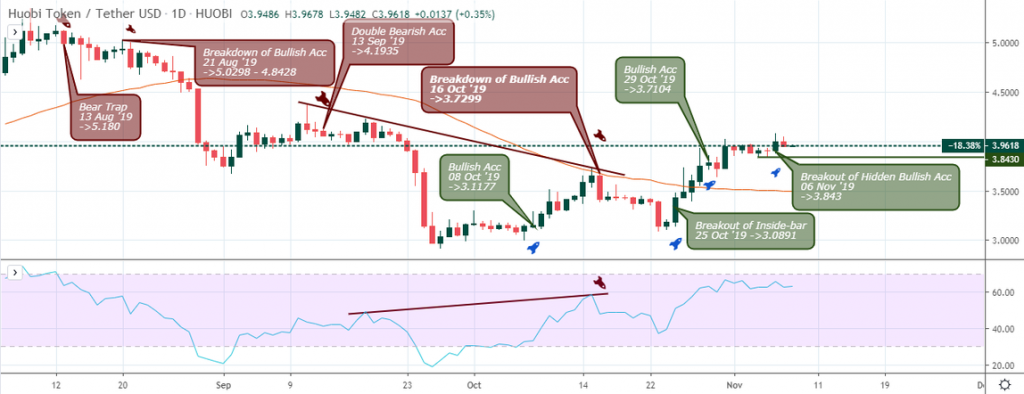
The HT coin price whipsawed after breaking the above hidden bearish accumulation resistance on November 06.
We are actually projecting a price target of $5.0 as we come to the end of the last quarter 2019.
Conclusion
The total crypto market cap, excluding the BTC bounce off the MA-50 from a monthly chart perspective, shows a highly probable growth in the industry at large.
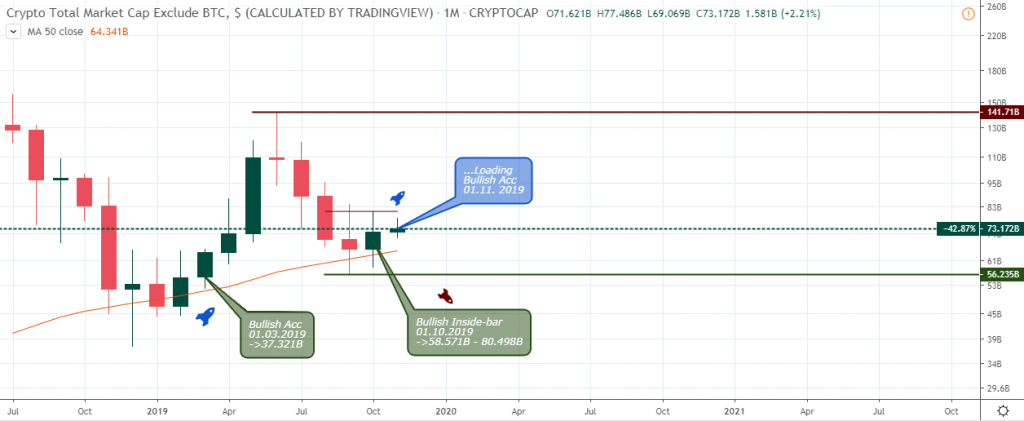
The recent increase in Bitcoin futures volumes implies an increase in institutional money into the industry.
General market fundamentals show a healthy crypto ecosystem but the market price is still playing catch-up. We will go on a limb and project that most of the top five cryptos show a strong chance that they may close bullish by the end of Q4.
Disclaimer
Content provided by CryptoTraderNews is for informational purposes only, and should not be construed as legal, tax, investment, financial, or other advice. All information is of a general nature. As always, there is risk with any investment. In exchange for using our products and services, you agree not to hold CryptoTraderNews Pro, its affiliates, or any third party service provider liable for any possible claim for damages arising from decisions you make based on information made available to you through our services.
[/wlm_private]
Want to read the rest of the article? Join our pro-membership and receive all of the following:
✅Access to ALL content.
✅Access to the CTN editorial staff.
✅Access to our CTN trading dashboard.
✅Access to our exclusive telegram channel where all our pro-members and editorial staff are in.
✅Ability to request content/research material!