
We’re about to put 2019 behind us and Bitcoin has had its serving of bearish and bullish sentiment to keep Crypto Twitter engaged, analysts pouring over their charts to predict futures, and day traders busy as they’ve worked very hard to accumulate their crypto wealth this year.
[wlm_private “Crypto Trader Pro – Monthly|Crypto Trader Pro – Yearly|Crypto Trader Pro (Lite)”]
According to Jason Williams, Co-Founder & Partner at Morgan Creek Digital, he believes that the Bitcoin halving will have little to no effect on how current miners are preparing for the May 2020 event.
While some Bitcoin maximalists believe that BTC can reach as high as $100K or higher in 2020, other analyst believe that price performance will remain about the same as long as we’re holding the current position.
In this post, we’ll be analyzing the overall chart of the BTCUSD price pair and identify the impact of some major events and price drivers in 2019.
BTCUSD: Monthly Time Frame
Bulls had a breakout of bullish accumulation on 01 April, 2019 to reach $5,700. The BTC price kept rising with an increase of about 159.33%.
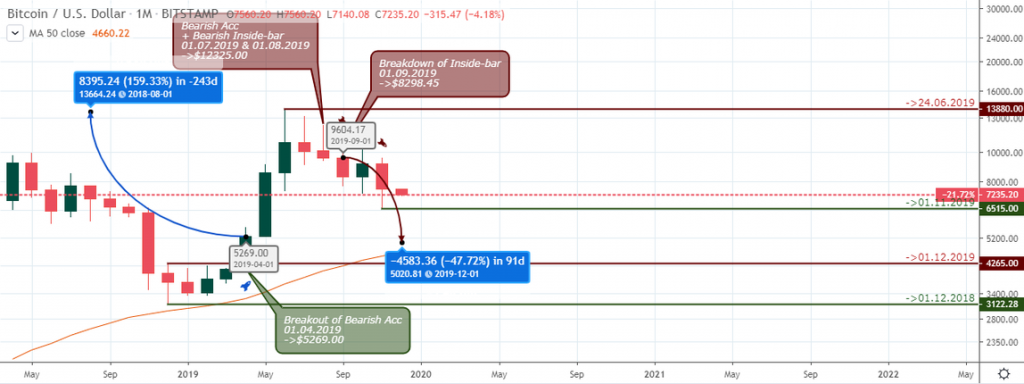
The bearish accumulation bar on the 1st of July 2019 indicated the loss of bullish momentum. The breakdown of the Inside-bar in September 2019 at $8,298.45, increased the bearish momentum in the Bitcoin market.
Currently the price has decreased by 47.75% and if the December candle can close below the previous candle, we may see another bearish momentum to the next support level of $5,269.00.
BTCUSD: Weekly Time Frame
Bitcoin BTC CME: December
The Bitcoin CME: The December 28, 2018 event coincided with the breakout of bearish accumulation on the price chart for a price influence of about +31.40%.
We look more into that below.
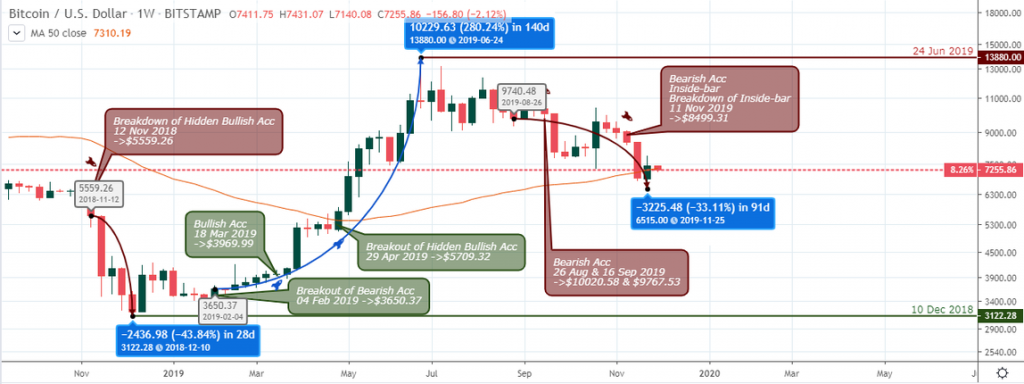
During the end of the 4th quarter of 2018, BTC had a bearish trend of 43.84% decrease. The price of Bitcoin was in range between the low on December 10, 2018 at $3,122 and the high on February 4, 2019 at $3,650.37.
The bullish accumulation break up on March 18, 2019 gave rise to the uptrend of 2019 Bitcoin of 280.24% increase.
Breakout of the hidden bullish accumulation and a close above the 50-MA is a good time for investors to buy more BTC with confidence at $5,709.32. This gives a good risk to reward ratio of 1:2 or 1:3 using the low of that weekly candle stick as stop-loss.
Decline in BTC Miners’ Reward
A sharp decrease in miners’ rewards resulted in a sharp rejection of BTC on June 24, 2019 after the market had made a rally of 280.24% to see a price breakthrough above $10K at $10,229.63.
The bearish accumulation buildup started on the September 16, 2019 signaling the fall in price of Bitcoin.
After the first break down of the support in September, the market retest that zone again and had another Bearish Accumulation inside bar on November 11, 2019 at $8,499.31. The BTC market has fallen 33.11%.
BTCUSD: Daily Time Frame
On the Daily Time Frame, we can see that there was a bullish divergent on the MACD oscillator, from December 2018 into January 2019, saw the price of BTC continue to fall.
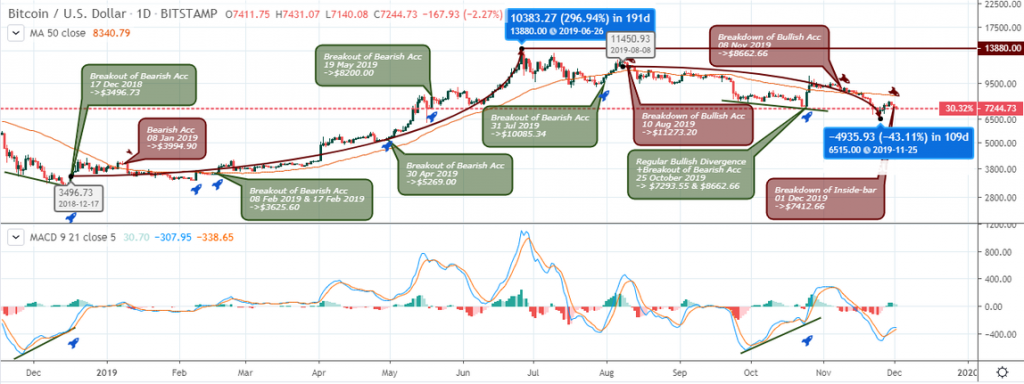
As of March 2019, the price closed above 50-MA signaling that the bullish accumulation was a sign for an uptrend, and the market rallied 296.94% during the uptrend of BTC in 2019, only to collapse by roughly 43.11% in the remaining half of the year.
China President Xi JinPing
The market was making lower lows while the MACD oscillator was making higher highs for a bullish divergent pattern during the October rally; triggered from statements by President Xi JinPing of China that there would be support for the development of blockchain-based technologies.
The bullish price rally was short lived when it touched the 50-MA which acted as resistance. The bearish accumulation indicates that there were more sellers in the market.
Two-Side Conclusion
Bullish Scenario
In our bullish scenario, we expect the Bitcoin prices to first dip towards the 200-weekly Moving Average before launching a bullish campaign.
This, however, may more likely take place in the first quarter of Q1 2020.
If the bullish momentum can rise and close above the 50 weekly-MA, we should anticipate an upward surge in the price of BTC.
Bearish Scenario
In the bearish scenario, considering the series of rejection of bullish accumulation supports on the daily time frame, and a recent attempt to break the December 2, 2019 bullish accumulation support at $7,087.09, we project a price drop towards the $5K to $6K support area as we close out Q4 2019.
Disclaimer
Content provided by CryptoTraderNews is for informational purposes only, and should not be construed as legal, tax, investment, financial, or other advice. All information is of a general nature. As always, there is risk with any investment. In exchange for using our products and services, you agree not to hold CryptoTraderNews Pro, its affiliates, or any third party service provider liable for any possible claim for damages arising from decisions you make based on information made available to you through our services.
[/wlm_private]
Want to read the rest of the article? Join our pro-membership and receive all of the following:
✅Access to ALL content.
✅Access to the CTN editorial staff.
✅Access to our CTN trading dashboard.
✅Access to our exclusive telegram channel where all our pro-members and editorial staff are in.
✅Ability to request content/research material!
1 comment
[…] Bitcoin […]
Comments are closed.