Bitcoin (BTC) has strengthened against Gold (XAU) since October 2016 by roughly 95%.
Despite the huge gains attained by Bitcoin, Mark Mobius, a famous emerging market investor, believes that blockchain and Bitcoin are risky. He believes that a gold-backed Bitcoin will make the number one cryptocurrency valuable.
[wlm_private “Crypto Trader Pro – Monthly|Crypto Trader Pro – Yearly|Crypto Trader Pro (Lite)”]
Dallas Mavericks billionaire, Mark Cuban, however, said he hates gold as an investment, viewing Bitcoin to be like gold, both with value-based on supply and demand.
Let’s move on to analyze and identify the significant chart patterns driving the price of the XAUBTC. Hopefully, we can get some insights into Peter Schiff’s statement to Tom Lee when he said Bitcoin would never attain the $50K mark.
Long-Term Price Overview
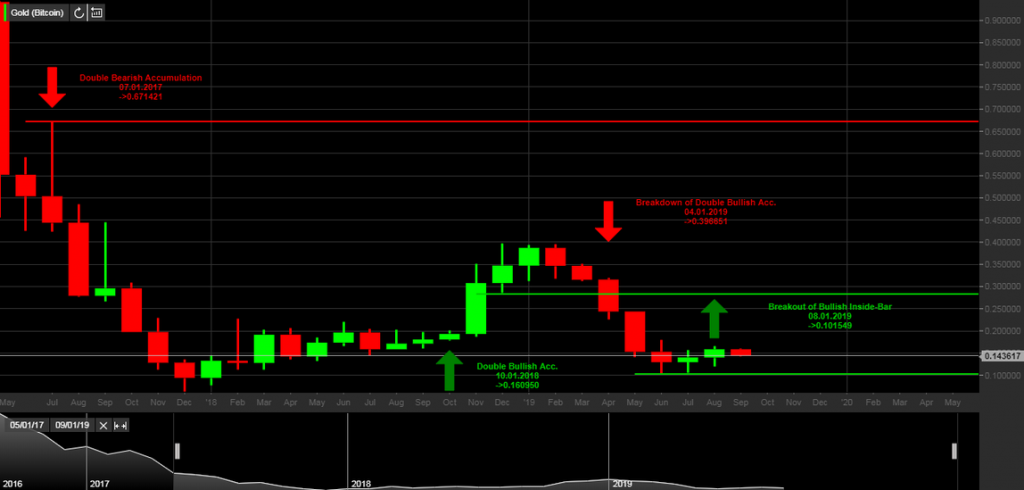
Following a top-down analysis, the monthly time frame revealed a double bearish accumulation pattern on July 01, 2017, for a price decline of about 75%.
XAUBTC Monthly
Crypto Winter of 2018 left us cold but XAU started gaining momentum against Bitcoin by forming higher lows.
A formation of double bullish accumulation on October 01, 2018 intensified the buying pressure after setting support at $0.160950.
The bullish momentum began to slow on January 01, 2019, and was later followed by a breakdown of bullish accumulation on April 01, 2019, leaving a sound resistance level behind at $0.396651, a roughly 55% price drop from the breakdown level.
Possible Price Scenario
The inside-bar candlestick pattern on July 01, 2019 shows the weakness of the bearish trend as the bulls closed above the inside-bar high of $0.155949 on August 01, 2019. This move suggests further price advancement to support gold. However, a price close below $0.118811 should confirm a continuation of the bullish trend.
Let’s move a step lower to the weekly time frame for a closer view of the price dynamics.
XAUBTC Weekly
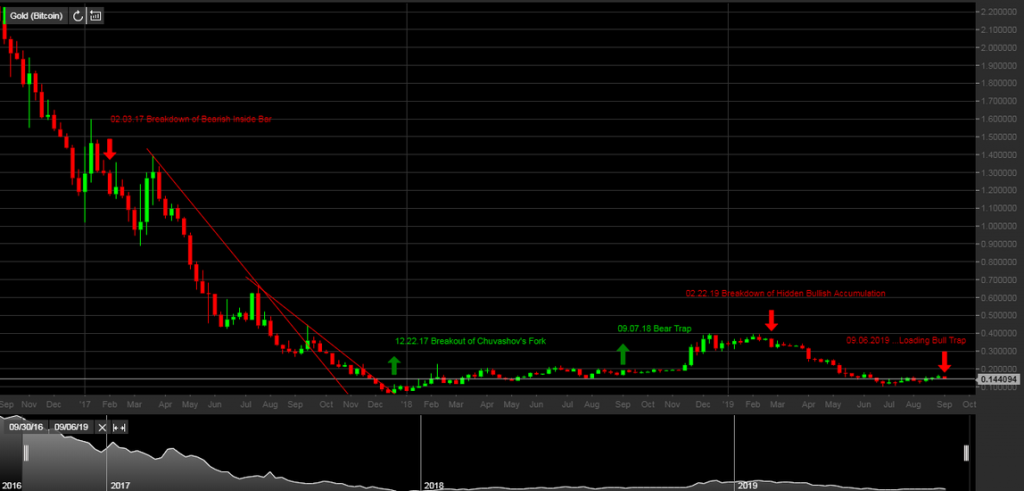
From the weekly chart above, a breakdown of bearish inside-bar on February 03, 2017, sparks an increase in selling pressure that lasted about forty-five weeks, and by roughly 95%.
On December 22, 2018, a breakout of the second bearish trend line, of the Chuvashov’s Fork confirmed an end to the prolonged bearish trend and ushers in the crypto winter of 2018.
The bear trap price pattern on the weekly time frame in combination with the double bullish accumulation on the monthly time frame within the same time interval sends the price higher by about 97%.
A collapse of hidden bullish accumulation on February 22, 2019 quickly confirmed a shift in trend from bullish to bearish and dropped by approximately 65%.
Now, coming to more recent times, the XAUBTC chart flags a breakout of hidden bearish accumulation on July 19, 2019, and a breakout of regular bearish accumulation on August 16, 2019.
Possible Scenario on the Weekly Time Frame
The unfolding bullish price patterns may restore strength to favor gold over bitcoin BTC. However, the expected bull trap price pattern this week should confirm a comeback in favor of Bitcoin BTC.
XAUBTC Daily
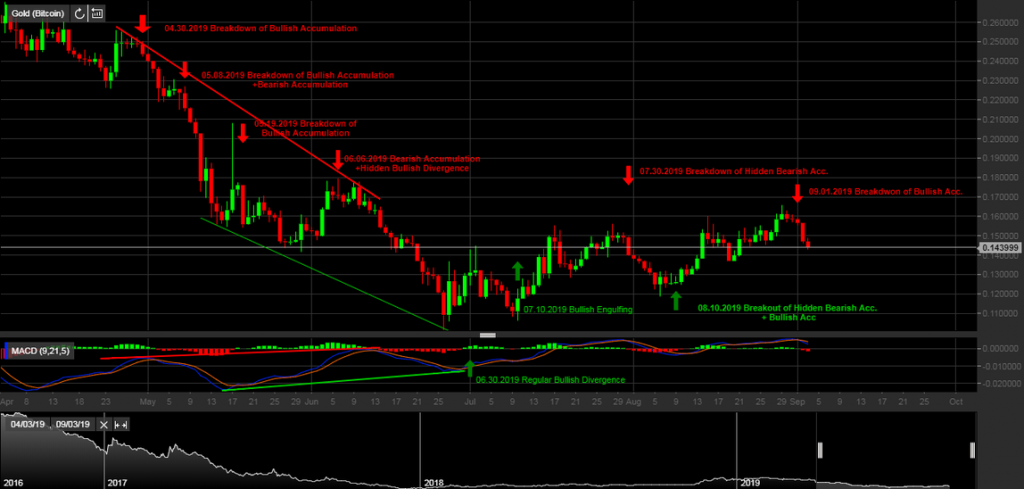
A view from the daily time frame reveals a mid-term overview of the early 2019 crypto-spring.
As shown above, a breakdown of the bullish accumulation pattern on April 30, 2019, May 08, 2019, and May 19, 2019, set the price rolling in the bearish direction.
After the extended 37% price descent from the hidden bearish divergence on June 06, 2019, the XAUBTC price flagged an opposing regular bullish divergence with the MACD oscillator on June 30, 2019. The pair sustained a mid-term bullish parabolic cycle from that point on setting higher lows at July 10, 2019, $0.106010, and August 06, 2019 $0.118811.
Possible Scenario on the Daily Time Frame
On September 01, 2019, a breakdown of bullish accumulation signal a series of bearish closing bars that may persist into the weekend.
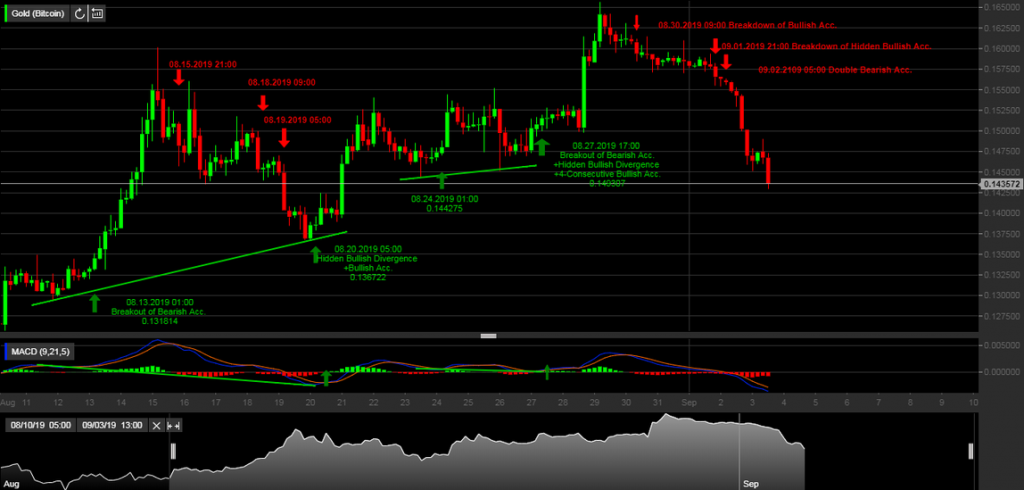
XAUBTC 4-hour
The 4-hour time frame below shows the XAUGBTC in a clear bearish trend as selling pressure breaks below support on August 30, 2019 09:00, September 01, 2019 21:00, before the double bearish accumulation pattern on September 02, 2019 05:00, about 13% from the August 30, 2019 09:00 price breakdown.
Conclusion
Although the Bitcoin dominance persists against XAU, we do not recommend a more extended holding period for short-sell positions. However, we can trade off bearish swings on the daily and 4-hour time frames.
Disclaimer
Content provided by CryptoTraderNews is for informational purposes only, and should not be construed as legal, tax, investment, financial, or other advice. All information is of a general nature. As always, there is risk with any investment. In exchange for using our products and services, you agree not to hold CryptoTraderNews Pro, its affiliates, or any third party service provider liable for any possible claim for damages arising from decisions you make based on information made available to you through our services.
[/wlm_private]
Want to read the rest of the article? Join our pro-membership and receive all of the following:
✅Access to ALL content.
✅Access to the CTN editorial staff.
✅Access to our CTN trading dashboard.
✅Access to our exclusive telegram channel where all our pro-members and editorial staff are in.
✅Ability to request content/research material!