
The market capitalization of Ether (ETH) retraces to approximately 25.2% from a high of $3.2 billion USD to $2.3 billion USD; a long way to go compared to the all-time high of about $145.7 billion USD.
According to a recent Bloomberg report on June 13, technical analysts at Fundstrat Global Advisory say we should expect an increase in price across cryptocurrencies going forward, as the Ethereum-based stablecoin, DAI, gets support from Coinbase among other optimistic events for the number two cryptocurrency by market capitalization.
Ethereum (ETH)
ETHUSD Monthly
Following an increase in buying power, as indicated by a bullish accumulation pattern on March 01 ’19 and support set at 125.88, the ETH price increased by approximately 112.6% from the candlestick pattern, before trading below the June opening price at press time.
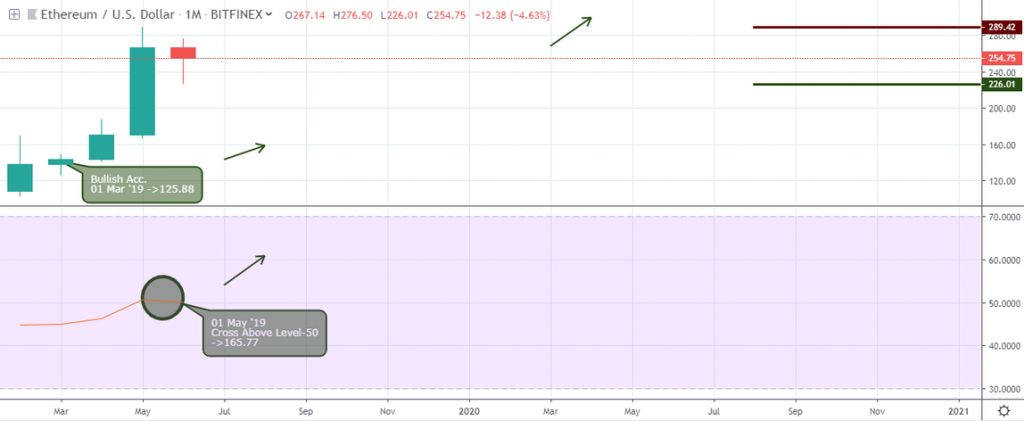
The price of Ether hovers between last month’s high of 289.42 and this month’s press time low of 226.01. With the RSI currently above the level-50, the bulls still maintain a firm grip on the price.
ETHUSD Weekly
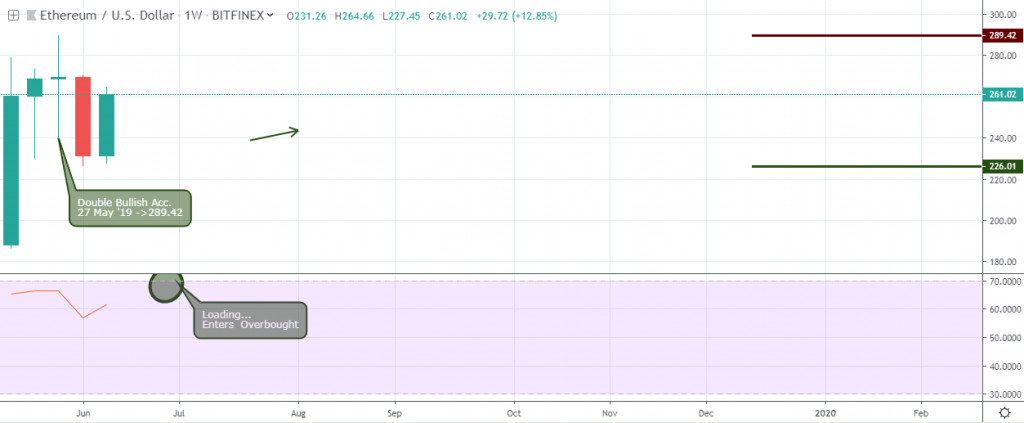
A double bullish accumulation pattern was signaled on May 27 ’19 with established support at 231.20. Last week’s closing price could not exceed the bullish support, showing that the bulls still have a hold on the market.
ETHUSD Daily
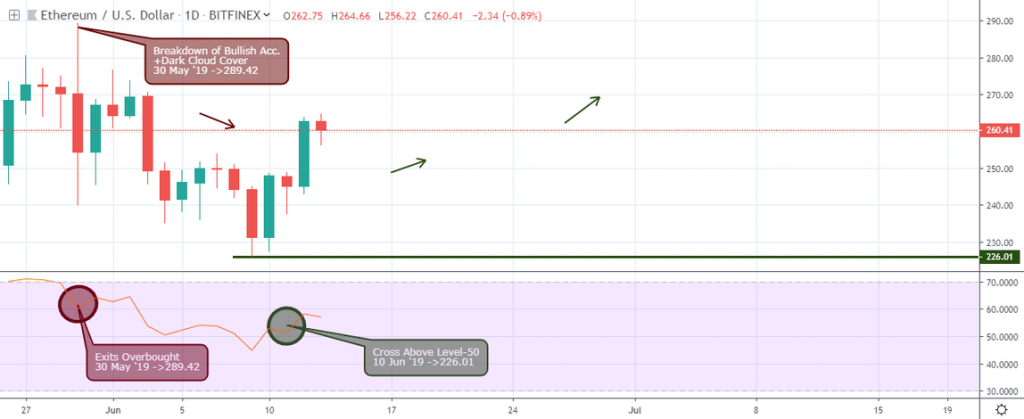
On May 30 ’19, ETHUSD exited the overbought area, triggering a dark cloud cover candlestick pattern that crashed through bullish accumulation support, after signaling a bearish accumulation pattern on May 29 ’19.
Getting to a low of 226.01, and with the RSI below level-50, the Ether price closed above the level-50 after signaling a bullish engulfing pattern on June 10 ’19.
If the bulls can maintain their grip and keep the price above the significant 226.01 support, we should then look forward to the further price rally.
ETHUSD 4-hour
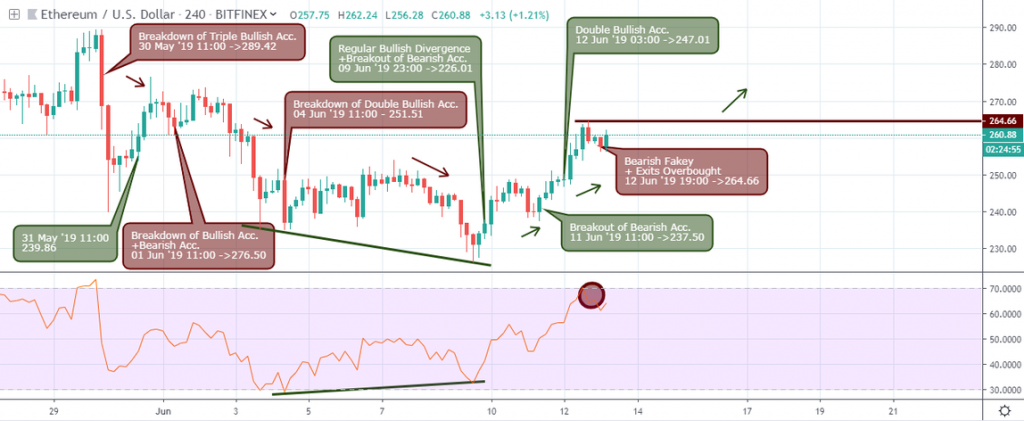
Here on the 4-hour time frame, the dark cloud cover candlestick pattern on the daily time frame was represented by a breakdown of triple bullish accumulation support on May 30 ’19 11:00, with strong resistance, established at 289.42.
From the breakdown of the collection of bullish support, the ETH price entered a descending channel built from further breakout and breakdown of bearish and bullish accumulation patterns on May 31 ’19 11:00 and June 01 ’19 11:00, with set resistance and support at 276.50 and 239.86.
The price descent ended after a regular bullish divergence pattern was signaled in combination with a breakout of bearish accumulation on June 09 ’19 23:00 again setting the critical support at 226.01.
Another breakout of bearish accumulation on June 11 ’19 11:00, followed by double bullish accumulation on June 12 ’19 03:00, sets the price in an upward trend where it later entered and exited overbought on June 12 ’19 19:00.
ETHUSD 1-hour
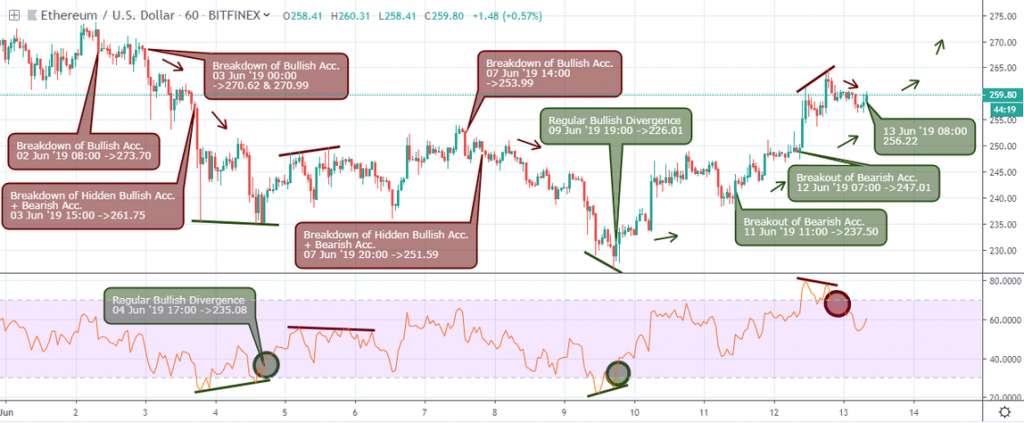
The above 1-hour intraday chart illustrates the events that have played out so far on the ETHUSD chart in mid-June.
Starting with a breakdown of bullish accumulation on June 02 ’19 08:00, ETHUSD plummeted by approximately 15.5%, as it breaks through bullish accumulation supports on its way down.
Both regular bullish and bearish divergence patterns on June 04 and 05 19:00 puts the price in an expanding channel where the pair again broke below bullish accumulation support on June 07 ’19 14:00.
The regular bullish divergence pattern signaled on June 09 ’19 19:00 aligned with a similar but broader time span regular bullish divergence pattern on June 09 ’19 19:00, raising confidence to enter long on the ETHUSD.
Significant Resistance Levels of Ether (ETH)
1-Hour
273.70, 270.99, 261.75, 253.99, 251.59
4-Hour
289.42, 276.50, 251.51, 164.66
Daily
289.42
Weekly
289.42
Monthly
289.42
Significant Support Levels of Ether (ETH)
1-Hour
235.08, 226.01, 237.50, 247.01, 256.22
4-Hour
239.86, 226.01, 237.50, 247.01
Daily
226.01
Weekly
231.20, 226.01
Monthly
125.88, 165.77
The combination of regular bullish divergence setups along with the rejection of selling resistance levels on the 4-hour and 1-hour time frames show that the price of ETH is well on its way out of the current range and set for a bullish rally.
We look forward to the pair trading above this month’s opening price while we suggest trading with tight protective stops below the crucial resistance and support levels.
Disclaimer
Content provided by CryptoTraderNews is for informational purposes only, and should not be construed as legal, tax, investment, financial, or other advice. All information is of a general nature. As always, there is risk with any investment. In exchange for using our products and services, you agree not to hold CryptoTraderNews Pro, its affiliates, or any third party service provider liable for any possible claim for damages arising from decisions you make based on information made available to you through our services.