
Two weeks into the month of June and the Bitcoin price still trades below the month opening price with market capitalization taking a dip from $161.3 billion USD to a low of $131.8 billion USD in mid-June. In an interview with Bloomberg on June 11, Barry Silbert, founder of Digital Currency Group (DCG) says the crypto winter is ended, and we are likely in a crypto spring.
Read on as we take a look at the technical levels driving the Bitcoin price.
Bitcoin (BTC)
BTCUSD Monthly
Even though there is still plenty of the month of June left, it has not behaved as the previous three months have due to its longest bearish shadow as the price currently trades below the opening price.
[rml_read_more]
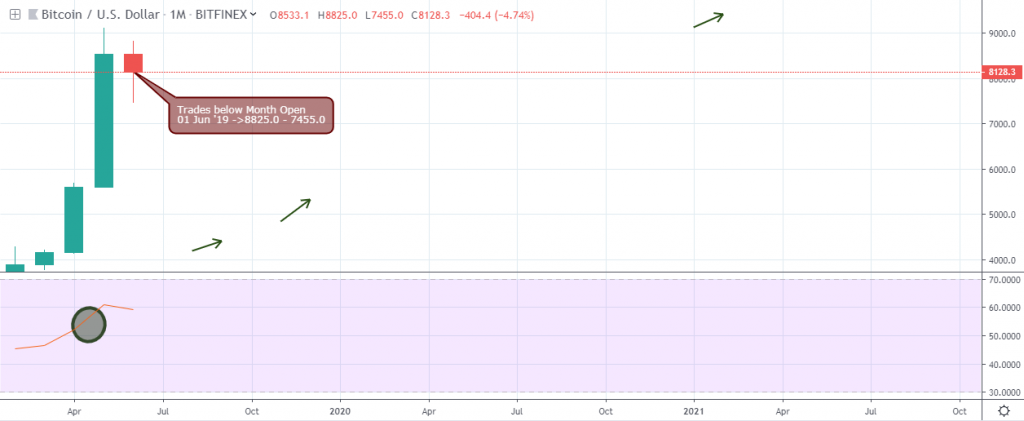
Considering a price close above the RSI level-50 on April 01 ’19, the price maintains a healthy bullish outlook on the monthly time frame. For many, this current bearish decline can be viewed as a mere retracement of the bullish trend.
BTCUSD Weekly
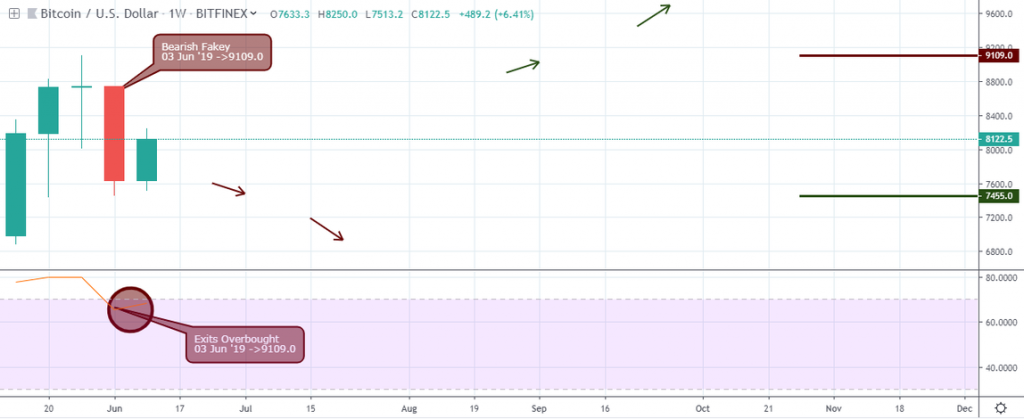
An exit from an overbought position in technical analysis usually results in either a total change in the trend of a crypto asset or a retracement of the initial bullish trend. In the above chart, it seems that there is a formation, in combination with a bearish Fakey pattern, which shows the weakness of the upbeat as the pair trades within resistance and support of 9109.0 and 7455.0.
BTCUSD Daily
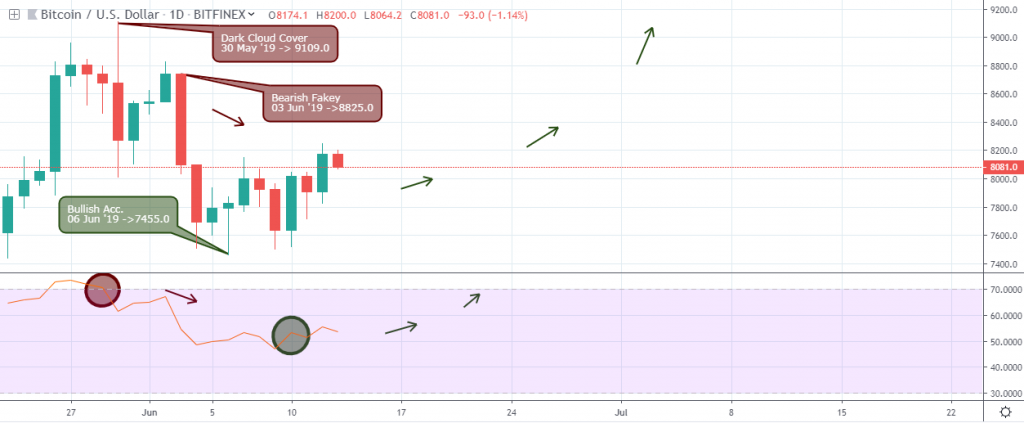
The BTCUSD showed the weakness of the bullish trend toward the last days of May signaling a bearish accumulation pattern; a dark cloud cover in combination with a breakdown of bullish accumulation on May 30 ’19, as the price exits overbought region.
A bearish Fakey pattern sent the price south, forcing the RSI below the level-50, where it signaled a bullish accumulation pattern on June 06 ’19 with support set at 7455.0.
With the cross above the RSI level-50, the price shows signs of bullish recovery.
BTCUSD 4-hour
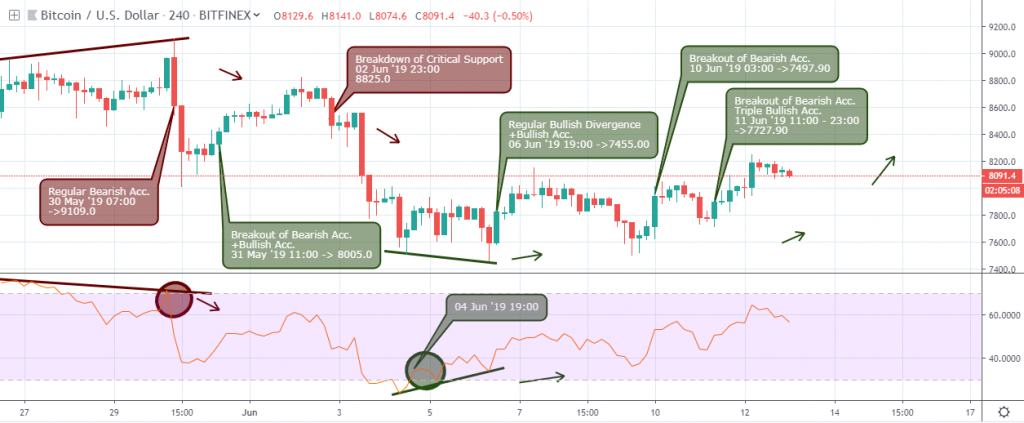
From a 4-hour time frame, the BTCUSD is enclosed within an expanding channel that’s built off opposing bearish and bullish divergence patterns on May 30 ’19 07:00 and June 06 ’19 19:00, with resistance and support at 9109.0 and 7455.0. The regular bearish divergence in combination with a breakdown of critical support on June 02 ’19 23:00 prompted the pair’s spiral down by approximately 13.2%.
On the other hand, the regular bullish divergence was signaled in combination with a bullish accumulation pattern. With the support of breakout of bearish accumulation resistance levels on June 10 and June 11 ’19, the price has increased by 5.9%.
BTCUSD 1-hour
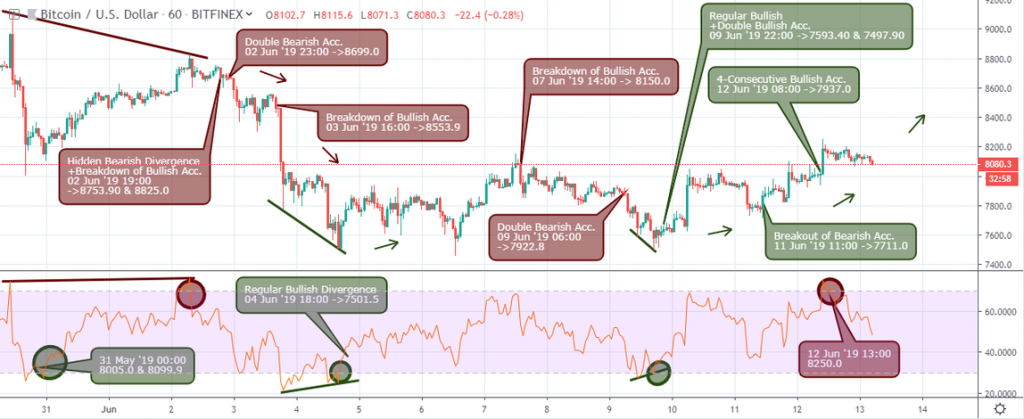
Following the illustration on the 1-hour time frame, BTCUSD exits oversold on May 31 ’19, for a price rally of about 7.0% before signaling a hidden bearish divergence pattern on June 02 ’19 23:00, confirming a continuation of an earlier bearish trend.
The pair declined by 7.4% from the hidden bearish divergence and was later opposed by a regular bullish divergence on June 04 ’19 18:00, with support established at 7501.5.
From the divergence support signaled on June 04, the price indicated another regular bullish divergence on June 09 ’19 22:00 after a price decline indicated by a breakdown of bullish accumulation on June 07 ’19 14:00.
Further gain in strength was realized after a breakout of bearish accumulation on June 13 ’19 06:00.
Significant Resistance Levels of Bitcoin (BTC)
1-hour
8753.90, 8825.0, 8699.0, 8553.9, 8150.0, 7922.8, 8250.0
4-hour
9109.0, 8825.0,
Daily
9109.0, 8825.0
Weekly
9109.0
Monthly
9109.0
Significant Support Levels of Bitcoin (BTC)
1-hour
8005.0, 8099.9, 7501.5, 7593.40, 7497.90, 7937.0, 7711.0
4-hour
8005.0, 7455.0, 7497.90, 7727.90
Daily
7455.0
Weekly
7455.0
Monthly
7455.0
Though we see a pullback in the total cryptocurrency market cap from the last few months’ high, as well as from Bitcoin prices, in the long term we look forward to further increases in Bitcoin prices.
The technical price patterns on the daily and 4-hour time frames should be sufficient to drive the price upward into the remaining half of the month as we trade with a protective stop below the significant support of 7455.0 USD.