
Ripple (XRP) is definitely an altcoin that we want to keep an eye on and we’ll be sharing chart indicators that are helping us predict its price in November 2019.
[wlm_private “Crypto Trader Pro – Monthly|Crypto Trader Pro – Yearly|Crypto Trader Pro (Lite)”]
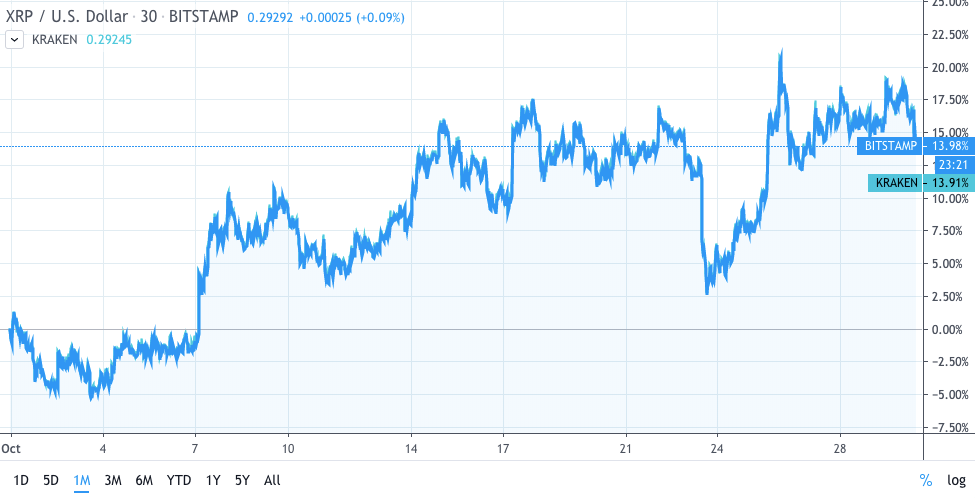
Ripple is currently trading at $0.292, above the $0.298 and $0.295 support levels against the USD. The price is likely to break the $0.306 resistance levels within the first two weeks of November.
There is a major rising channel forming with support near $0.299 on the hourly chart of the XRP/USD pair and the price is showing positive signs of breaking resistance. Bitcoin is trading sideways and this is a favorable time for XRP to accelerate higher than $0.310.
In the past three weeks we have seen a steady rise in Ripple prices above the $0.285 resistance level against the USD. Moreover, XRP/USD climbed above the $0.300 resistance level and settled well above the 100-hour SMA. There was a new high above the $0.306 level and the recent swing took the price to the $0.3065 level. Currently the price is correcting below the Fib Retracement level of the upward move from $0.293 to the $0.30 level. There is an immediate support on $0.289 and it coincides with the 50% Fib Retracement level.
There is a major rising channel forming support near the $0.30 level based on the chart. More importantly, the 100-hour SMA is near the $0.298 area to provide support. In November we expect a downside break below the $0.298 support and the next major support is near the $0.295 level. If the price falls below this, it may revisit the $0.288 support zone and the $0.285 pivot area. There is more support for the upward movement of the price and initial resistance will be encountered near the $0.306 level. If there is a clear break above the $0.306 level, the price is likely to climb towards the $0.310 and $0.312 levels.
The monthly chart shows several positive signs for the price above the $0.300 and $0.298 levels. As long as there is no close below the $0.298 support area, there could be an upside continuation. However, if there is a sell-off, the price may perhaps start an extended downside correction towards the $0.288 and $0.285 support level. The RSI for XRP/USD is correcting lower and it could test the 55 level in November.
Disclaimer
Content provided by CryptoTraderNews is for informational purposes only, and should not be construed as legal, tax, investment, financial, or other advice. All information is of a general nature. As always, there is risk with any investment. In exchange for using our products and services, you agree not to hold CryptoTraderNews Pro, its affiliates, or any third party service provider liable for any possible claim for damages arising from decisions you make based on information made available to you through our services.
[/wlm_private]
Want to read the rest of the article? Join our pro-membership and receive all of the following:
✅Access to ALL content.
✅Access to the CTN editorial staff.
✅Access to our CTN trading dashboard.
✅Access to our exclusive telegram channel where all our pro-members and editorial staff are in.
✅Ability to request content/research material!