
From the breakdown of hidden bullish accumulation on November 1, 2018, the price moved from $0.15890000 to $0.051611400 for a -67.52% drop on September 1, 2019. The market has been in a downtrend since the last quarter of 2018 into 2019.
[wlm_private “Crypto Trader Pro – Monthly|Crypto Trader Pro – Yearly|Crypto Trader Pro (Lite)”]
Stellar Analysis
XLMUSD: Monthly Time Frame
During the end of the 4th Quarter of 2018, the market ranged between the high of $0.35200000 and the low of $0.18189000, before the breakdown of hidden bullish accumulation occurred on November 1, 2018.
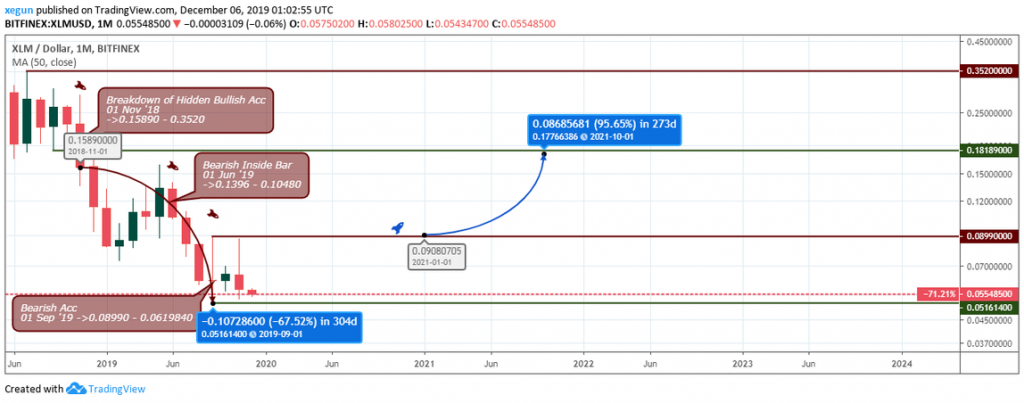
The close of XLMUSD at $0.15890000 on November 1, 2018 below the $0.18189000 support zone led to sellers taking over the market, pushing the price down to the low of $0.08990000.
Q2 market corrected the swing low back to the upside, retesting the previous level of support that was broken at $0.181890000. At the end of Q2, June 1, 2019 there was a bearish inside bar with a range between $0.1396 and $0.10480, indicating that sellers are coming back into the market.
Q3 was bearish with an inside bar indicating that more sellers were placing orders in the market. This eventually pushed the price down. The last Doji candle for Q3 indicates a lot of indecision to end the month. Q3 hit a low of $0.0511400 before closing with a Doji. This often indicates that some investors’ have taken profit.
Q4 had a price ranging between the high of $0.08990000 and low of $0.051400. The momentum to the upside is very low but the market was in a support zone at $0.05548500.
XLMUSD price fell to the low of the bearish accumulation of $0.08990 to $0.019840 on September 2, 2019. If the price closes below $0.05111400, we may see XLMUSD falling even lower again.
XLMUSD: Weekly Time Frame
XLM Snapshot XLL Fork
The XLM snapshot even for XLL Fork took place on January 28, 2019 and was interpreted as negative news for Stellar.
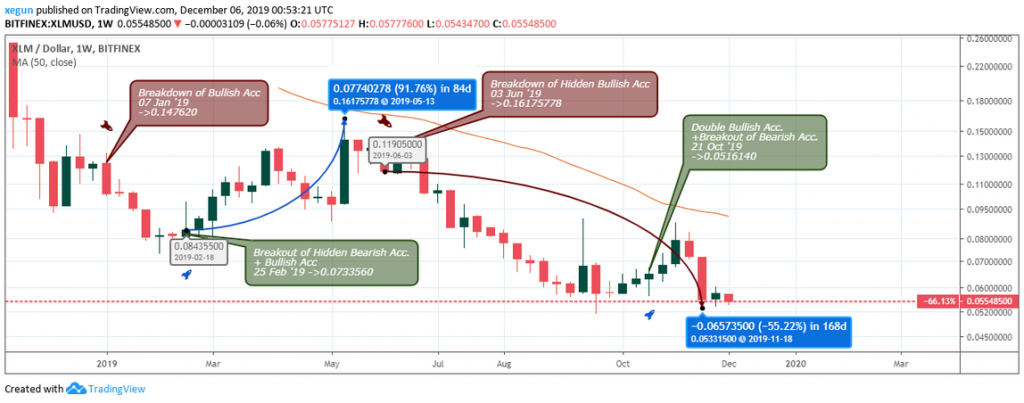
2019 started with the breakdown of a bullish accumulation on January 7, 2019 at $0.147620. It showed a bearish engulfing candle, which indicated that the sellers are taking over the market, pushing the price of XLMUSD down, and finding support around $0.0733560 on February 18, 2019.
XLM Testnet Reset
On February 27, 2019, the testnet reset event had a positive impact on the price of Stellar by +31.40%. After the market established support, there was a breakout of hidden bearish accumulation and bullish accumulation on February 25, 2019 at $0.084355500. This led to a rise in the XLMUSD price correction of the previous swing low in 2018.
The XLMUSD price increased 91.76% to $0.16175778 on May 13, 2019 from $0.08435500 on February 18, 2019. The 50-MA acted as resistance and the price could not close above it.
On June 3, 2019 the price was at $0.1175778. A breakdown of hidden bullish accumulation closed the price at $0.11905000, which led to a fall in XLMUSD price a continuation of the bearish trend. XLMUSD fell to a support zone of $0.05548500.
Improve Decentralization, Q3 Protocol, Projects Using Wallet SDK 29, Kelp Bot Improvement, Improved Node, Minor Release on September 2019 also contributed to a +31.40%, and +15% price increase of the XLMUSD.
The market made a double bullish accumulation and breakout of bearish accumulation on October 21, 2019 at $0.0516140. The rise in price was just for a few weeks before hitting a resistance zone of the 50-MA and it was falling. The price fell by -55.22% to $0.0331500 from the close of $0.11905000 on June 3, 2019.
XLMUSD: Daily Time Frame
On the daily time frame, we look at January 10, 2019 for a breakdown of bullish accumulation between $0.132220 and $0.110210. There was firm rejection of the price below the 50-MA, which pushed the XLMUSD price down. The downtrend ended with a breakout of bearish accumulation on February 1, 2019 between $0.075940 and $0.0811390.
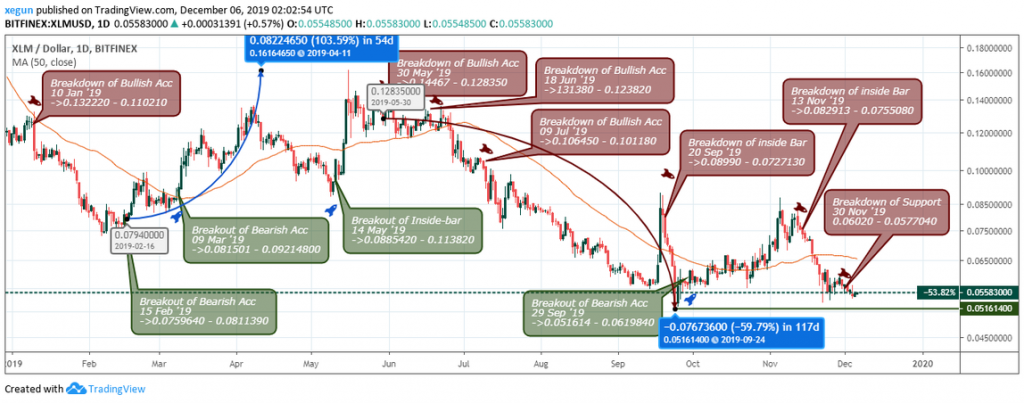
A close of $0.07940000 on February 15, 2019 was the beginning of a bullish run.
The market corrected the retest of 50-MA and had a breakout of bearish accumulation on March 9, 2019 between $0.081501 and $0.09214800. The XLMUSD had an upward increase of 103.59% on April 11, 2019 at $0.16164650.
May 14, 2019, there was a breakout of the inside bar with prices between $0.0885420 and $0.113820, which the bulls enjoyed as the price worked its way up.
Then on May 30, 2019, there was a breakdown of bullish accumulation between $0.14467 and 0.128350 with a close at $0.12835000. This led to the beginning of the downtrend with June 18, 2019, indicating a breakdown of bullish accumulation between $1.31380 and $0.123820, and more pressure to the downside.
July 9, 2019, break down of bullish accumulation between $0.106450 and $0.101180 price is under the 50-MA, which tells us that more sellers are placing orders. The market drew down to a low of $0.05583000 after the September 20, 2019 breakdown of the inside bar between $0.08990 and $0.0727130. But on September 29, 2019, a breakout of bearish accumulation between $0.051614 and $0.0619840 led to an increase in price for a while.
Finally, on November 13, 2019, breakdown of the inside bar between $0.082913 and $0.0755080 reversed the previous uptrend. XLMUSD price dropped backed to the previous support zone of $0.05583000.
The Bears and Bulls Scenario
Bullish Scenario
The primary trend of the market has been bearish; therefore, the upside trend is not guaranteed until price breaks out of the recent high it made. Looking at the markets now, the trend has been to short sell and and get back into the market.
Bearish Scenario
The XLMUSD price fell by -59.79% from $0.05161400 on September 24, 2019 from the close of $0.12835000 on May 30, 2019. The bears were in control of the market. Today, sellers might have missed an opportunity to buy below $0.05161400 but these are volatile times and the sea of green indicates the bears are hibernating.
Disclaimer
Content provided by Crypto, Trader, News. is for informational purposes only, and should not be construed as legal, tax, investment, financial, or other advice. All information is of a general nature. As always, there is risk with any investment. In exchange for using our products and services, you agree not to hold CryptoTraderNews Pro, its affiliates, or any third party service provider liable for any possible claim for damages arising from decisions you make based on information made available to you through our services.
[/wlm_private]
Want to read the rest of the article? Join our pro-membership and receive all of the following:
✅Access to ALL content.
✅Access to the CTN editorial staff.
✅Access to our CTN trading dashboard.
✅Access to our exclusive telegram channel where all our pro-members and editorial staff are in.
✅Ability to request content/research material!
1 comment
[…] Altcoins […]
Comments are closed.