
We’re closing out the first full week of 2020 and it seems like a good time to check our six to see where we’ve been in the crypto market and try to make predictions for where we’re going. In our spotlight for 2019 market analysis is Spot Gold.
In 2019, it maintained a sound bullish trend after a series of bearish closing bars in the last quarter of 2018. In this article, we’ll analyze the Elliot Wave structure of the XAUUSD trade pair through 2019, and lose with the potential bears and bulls prediction for Q1-2020.
[wlm_private “Crypto Trader Pro – Monthly|Crypto Trader Pro – Yearly|Crypto Trader Pro (Lite)”]
Spot Gold Analysis
XAUUSD: Monthly Time Frame
After a collapse of hidden bullish accumulation on May 1, 2018, XAUUSD dipped by approximately 10.64%.
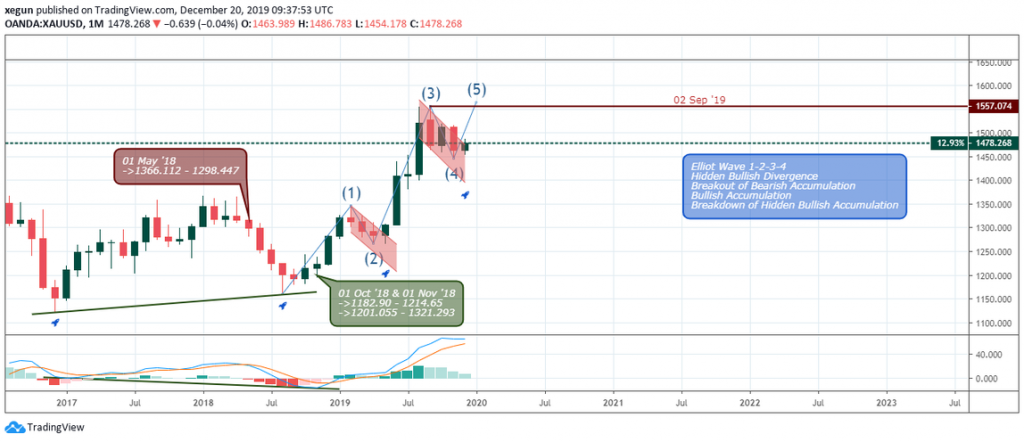
The Q4 2018 price plunge then saw the price of spot gold increase in demand, which was revealed as a breakout of bearish accumulation, a bullish accumulation, and a hidden bullish divergence pattern in October and November 2018.
The combination of technical patterns identified above set the XAUUSD into a sound 1-2-3-4-5 Elliot Wave pattern, with the first Impulse Wave-1 on August 1, 2018 at $1,160.324 to February 1, 2019 at $1,346.743.
This was followed by Corrective Wave-2 from February 1, 2019 at $1,346.743 to April 1, 2019 at $1266.421; Impulse Wave-3 from April 1, 2019 at $1,266.421 to September 2, 2019 at $1,557.074; Corrective Wave-4 from September 2, 2019 at $1,557.074 to November 1, 2019 at $1,445.707.
XAUUSD: Weekly Time Frame
A view from the weekly time frame shows the XAUUSD breaking above the $1,212.748 bearish accumulation resistance in October 2018 and November 2018 for the Impulse Wave-1.
The corrective Wave-2 and Wave-4 from the weekly chart perspective signal a bullish flag.
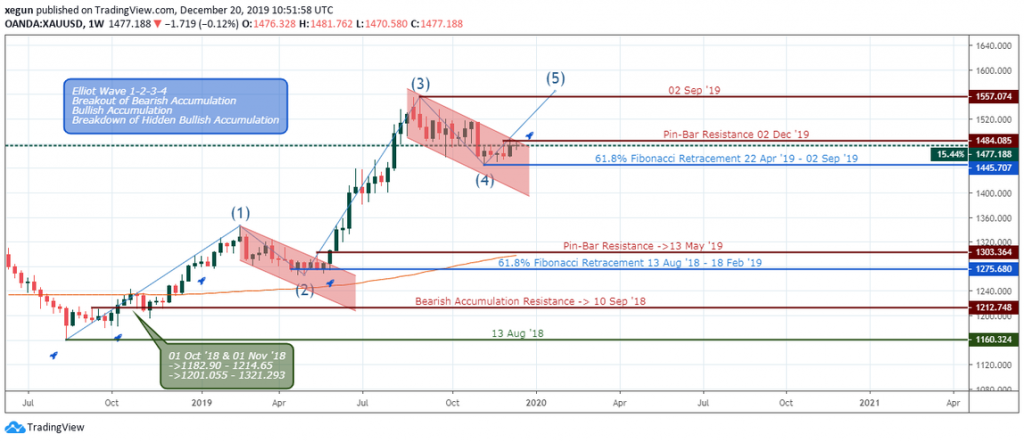
In the chart above, on May 13, 2019, bearish pin-bar resistance confirmed an exit of the bullish flag and initialized the Impulse Wave-3.
XAUUSD: Daily Time Frame
Rounding up on the daily time frame, the XAUUSD closed above the MA-200 on December 20, 2018, and continued to establish higher highs.
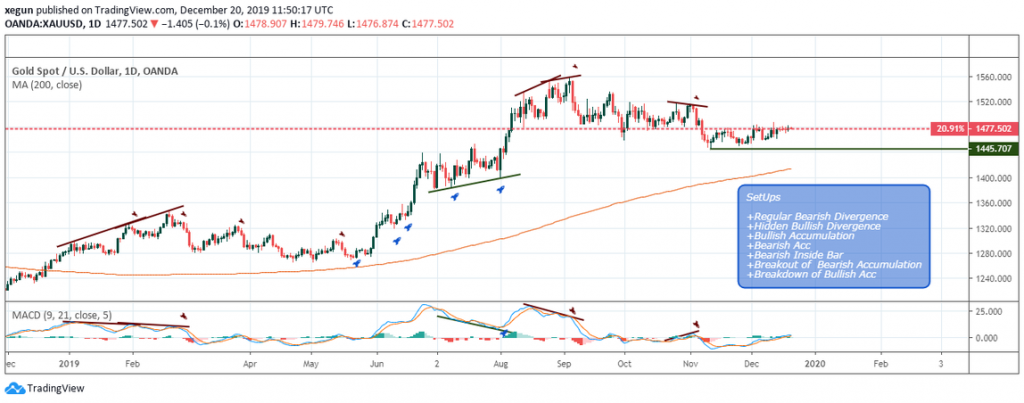
The higher highs from the breakout transitioned into consecutive regular bearish divergence patterns on February 4th and 27th of 2019, slowly corrected the price increase back towards the MA-200.
A breakout of triple bearish accumulation resistance at $1,273.761 on May 23, 2019, forced the price of Gold out of the corrective Wave-2, offering a low-risk entry point for a long order.
The bulls pushed the trend higher by about 21.30% from the May 23rd breakout level, after which the bears again signaled a series of regular bearish divergence on August 29th and September 5, 2019, completing the Impulse Wave-3.
From the end of Q2-2019, XAUUSD entered the corrective Wave-4 and has been on that level for about 14 weeks now.
A price close above the recent double bearish accumulation resistance of $1,480.561 will confirm and end to the corrective Wave-4 and beginning of the impulse Wave-5.
The Bears and Bulls Scenario
Bullish Scenario
If the price of gold closes above the December 2, 2019 resistance from the weekly time frame, we should expect a similar upward surge in price, confirming the beginning of the Impulse Wave-5.
Bearish Scenario
On the other hand, a close below the 61.8% Fibonacci on the weekly time frame means we should expect a further dip in the corrective Wave-4.
While we are still in the corrective Wave-4 in the last month of Q4-2019, we project a bullish closing month by the end of the year and a start of the impulse Wave 5 into Q1-2020.
Disclaimer
Content provided by Crypto,Trader,News. is for informational purposes only, and should not be construed as legal, tax, investment, financial, or other advice. All information is of a general nature. As always, there is risk with any investment. In exchange for using our products and services, you agree not to hold Crypto,Trader,News. Pro, its affiliates, or any third party service provider liable for any possible claim for damages arising from decisions you make based on information made available to you through our services.
[/wlm_private]
Want to read the rest of the article? Join our pro-membership and receive all of the following:
✅Access to ALL content.
✅Access to the CTN editorial staff.
✅Access to our CTN trading dashboard.
✅Access to our exclusive telegram channel where all our pro-members and editorial staff are in.
✅Ability to request content/research material!