
Whether you’ve traded different asset classes or just venturing into the cryptocurrency market, you will realize that there are different technical chart and price formations for identifying a bear market.
In this article, we will only review high probability bear market setups which strive to save you from stress, time and, above all, money, to avoid repainting and crystal ball indicators.
Divergence
Look for a low-risk to a higher reward way of selling close to the top of an overbought cryptocurrency or as a profit-taking target while you are in a long position. Be on the lookout for bearish divergence patterns to come to the rescue.
Bearish Regular Divergence
[rml_read_more]
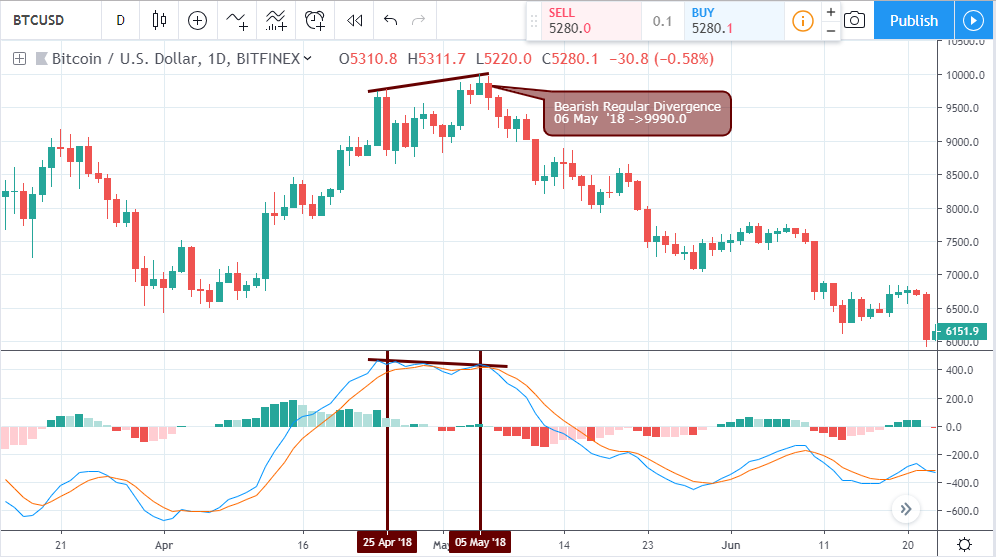
The bearish divergence setup compares peaks of a crypto asset to the peaks of an oscillator, say the Relative Strength Index (RSI) or Moving Average Convergence and Divergence (MACD), as shown on the above daily chart of the BTCUSD.
Notice that the price made higher highs on May 06 ’18, while the MACD oscillator made a lower higher, consequently sending the pair into a downward spiral.
Bearish Hidden Divergence
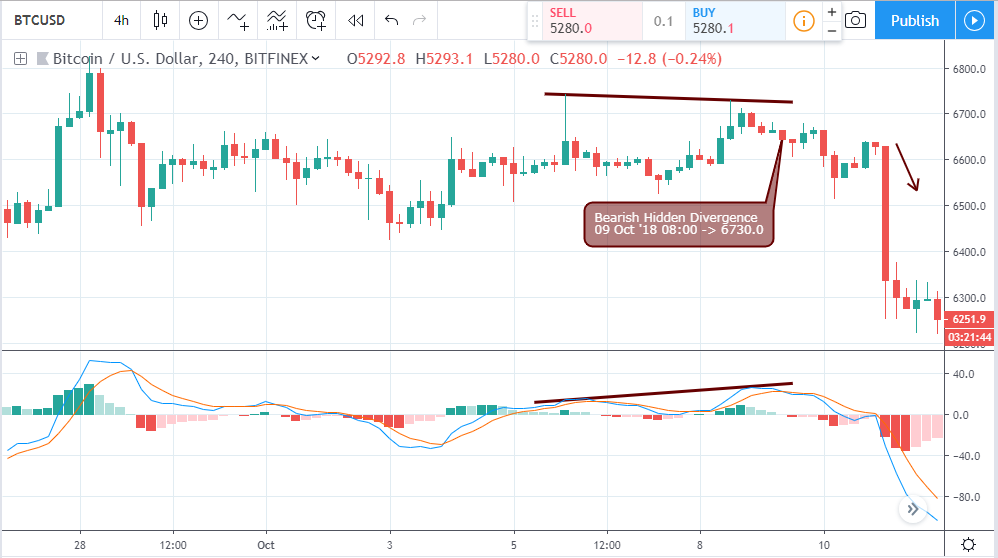
Another variant of bearish divergence is a hidden bearish divergence pattern which, in most cases, shows the continuation of a bearish trend as illustrated above for a 4-hour time frame of the BTCUSD.
The Bitcoin price makes a lower high compared to a higher high of the MACD oscillator on October 09 ’18 08:00, with set resistance at 6730 USD.
The Bitcoin price immediately entered into a bear market after a confirmed dead cross of the MACD oscillator.
Double Bearish Accumulation
The double bearish accumulation pattern is a setup that emphasizes selling pressure.
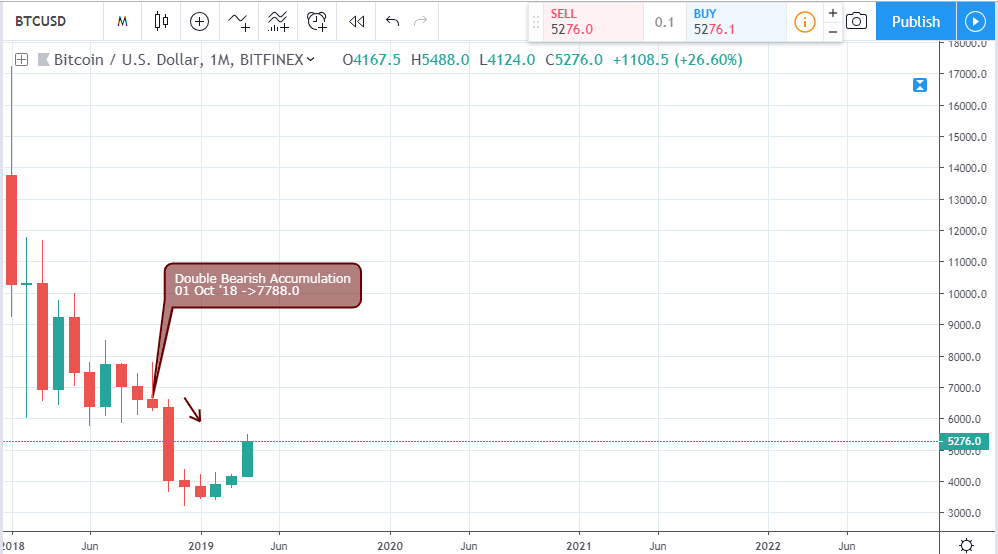
It is similar to an inside bar candlestick pattern, except that it is identified by comparing two bearish closing candlesticks (bars), and it considers only the body of the recent candlestick closing within the high-low range of the mother bar.
As shown on the above monthly time frame of the BTCUSD, the month of September ‘18 closed bearish within the high-low range of August, and the month of October ‘18 also closed within the high-low range of September ’18.
Formed in a sequence, the bearish closing candlesticks trigger a double bearish accumulation candlestick formation.
Breakdown of Bullish Accumulation
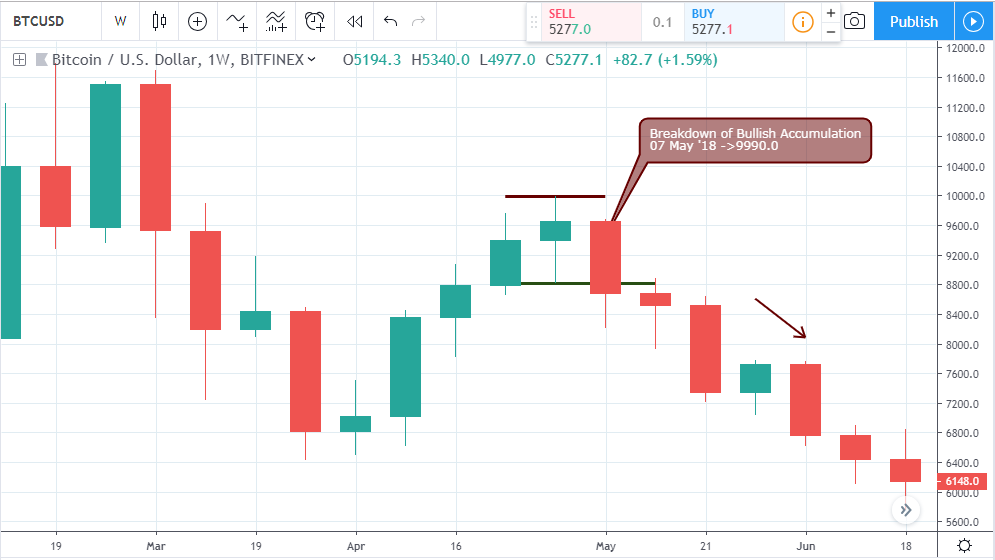
A rejection of buying pressure, also referred to as a bullish accumulation pattern, is an excellent bearish market signal. See the example above for the weekly chart of the BTCUSD.
First, a bullish accumulation pattern has to be formed, which is a recent candlestick closing in the same bullish direction as the mother bar. The body is within the high-low range of the mother bar with the low of the child bar as the set support.
A breakdown of bullish accumulation is signaled if the coming candles do not close above the high of the child-bar, which is resistance, but also closes below the low of the child bar, which indicates support.
It has a high probability of signaling a polarity switch from a bullish to bearish market sentiment, as shown on May 07 ’18 of the above chart.
Exit of RSI Overbought and Entry of Oversold
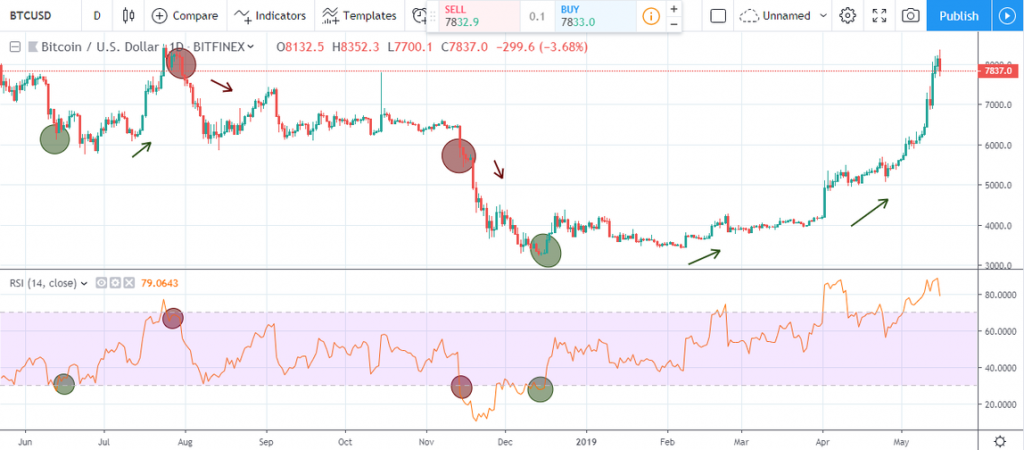
The above daily chart illustrates an exit of RSI level-70 identified with the first red circle during the cryptocurrency winter, clearly identifying an overbought Bitcoin.
After ranging for about two to three months, the price entered the oversold region by a cross below the RSI level-30, identified by the second red circle and stressing further increase in selling pressure.
The exit of overbought and entry of oversold level of the RSI oscillator are excellent bear market signals, especially when the price has already begun to show weakness.
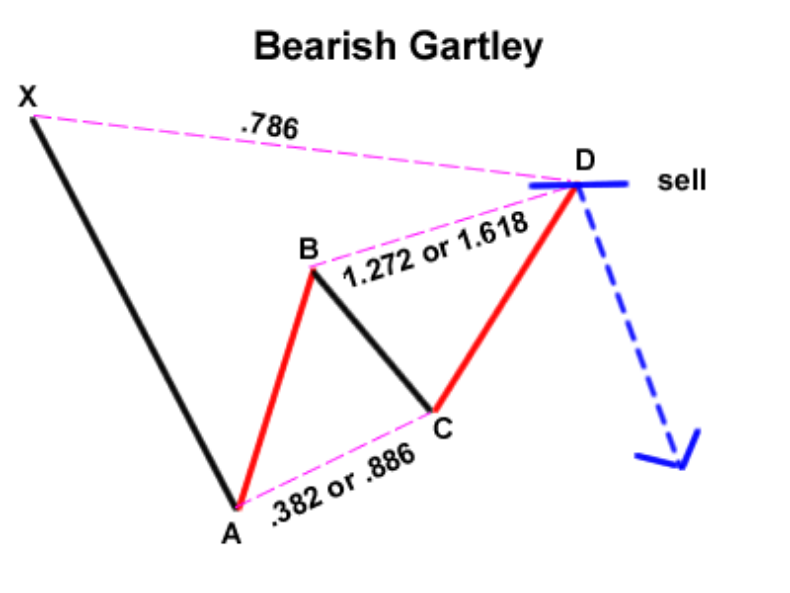
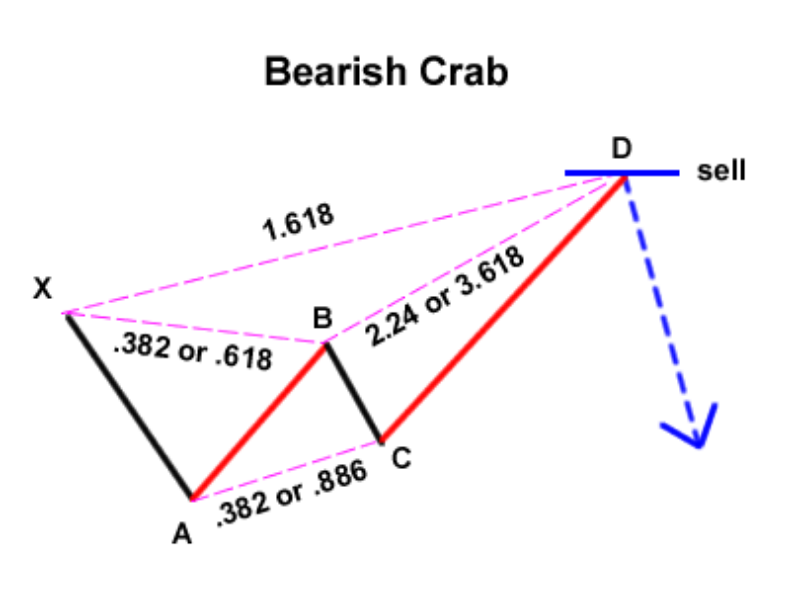
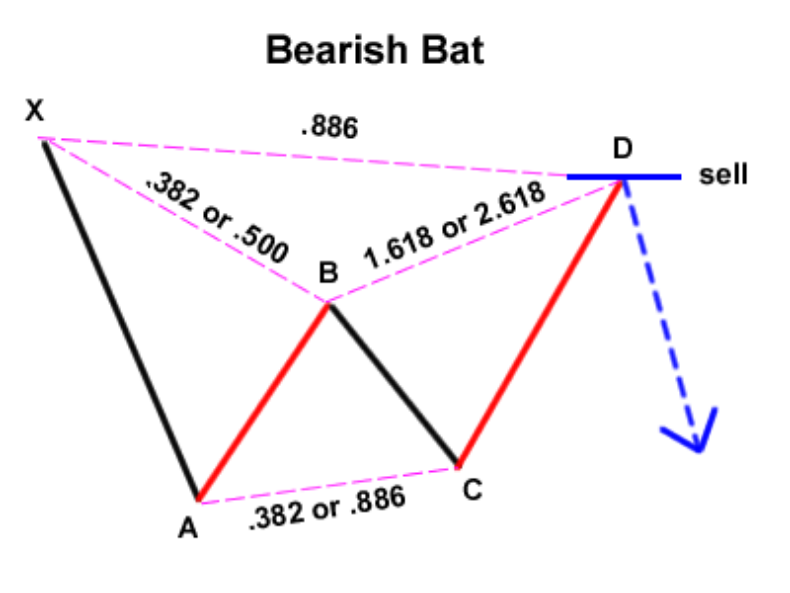
Bearish Harmonic Patterns
The bearish harmonic patterns, such as the Bearish Gartley, Bearish Crab, and Bearish Bat are a little trickier to identify because they make use of Fibonacci numbers; however, they should not be ignored.
The illustrations shown below highlights the appropriate Fibonacci numbers and sequence through which these patterns are established.
Conclusion
It is worth mentioning that these setups are excellent identifiers for a bear market when applied as a unit especially on a higher time frame, which offers more confidence to enter a short position on a cryptocurrency pair.
Disclaimer
Content provided by CryptoTraderNews is for informational purposes only, and should not be construed as legal, tax, investment, financial, or other advice. All information is of a general nature. As always, there is risk with any investment. In exchange for using our products and services, you agree not to hold CryptoTraderNews Pro, its affiliates, or any third party service provider liable for any possible claim for damages arising from decisions you make based on information made available to you through our services.