
INTRODUCTION
The cryptocurrency space experienced many activities in the second quarter of 2019 with Bitcoin (BTC) apparently leading the charge in most frontiers and showing much stability in the quarter. Bitcoin (BTC) prices rallied by roughly 245.0%, a first since the crypto winter of 2018.
[wlm_private “Crypto Trader Pro – Monthly|Crypto Trader Pro – Yearly|Crypto Trader Pro (Lite)”]
Q2 saw the mining difficulty of Bitcoin go up by over 11% in May, a then all-time high for the network. Meanwhile, the hash rate continued to rise firmly over the quarter, reaching record-breaking peaks in June. Bitcoin has had one of the most influential quarters yet, with its market dominance reaching a high it has not seen since 2017.
These events, among a host of others, make up the summary of BTC’s activities in Q2-2019. Below we shall look at some of these significant events and technical chart patterns driving the Bitcoin price.
PRICE RALLY
Q2 saw a Bitcoin record price rally akin to its rally in 2017 that a historical high of $20,000. This time, however, the price of BTC surged above $8,200, an event that surprised many traders and suggested that the bear run was finally over.
SQUARE’S BITCOIN SALES DOUBLE IN Q2 2019
In its second-quarter earnings report, US-based payments company, Square Inc. revealed $125 million in Bitcoin sales through its Cash App. This figure nearly doubled its record first quarter.
The report stated Bitcoin sales of $125 million because of the increase in the price of BTC, which generated a gross profit of $2 million for Square during the quarter.
The company revealed that at $260 million, Bitcoin represented about 50% of the total revenue on its Cash App during the second quarter of 2019.
Other significant events in Q2 of 2019 include:
LAUNCH OF EURO AND GBP TRADING PAIRS ON VERTBASE
Vertbase announced that customers in Europe could buy digital currencies with the Euro and British Pound starting from May 1st, 2019. The announcement revealed that they would enable direct purchases for all digital currencies listed on Vertbase. These currencies included Bitcoin, DigiByte, Decred, Litecoin, Dogecoin, Vertcoin, Ravencoin, and Navcoin.
Vertbase announced that customers in Europe could buy digital currencies with the Euro and British Pound starting from May 1st, 2019. The announcement revealed that they would enable direct purchases for all digital currencies listed on Vertbase. These currencies included Bitcoin, DigiByte, Decred, Litecoin, Dogecoin, Vertcoin, Ravencoin, and Navcoin.
REAL ESTATE AUCTION SALE FOR BTC
LJ Hooker, one of Australia’s most prominent real estate companies, announced that a live luxury real estate auction for Binance Coin (BNB) and Bitcoin (BTC) with a live auctioneer would be held on April 8th.
Technical Analysis
As always, we carry out a top-down analysis of the BTCUSD pair starting with the monthly time frame and all the way down to the 4-hour time frame.
BTCUSD: Monthly
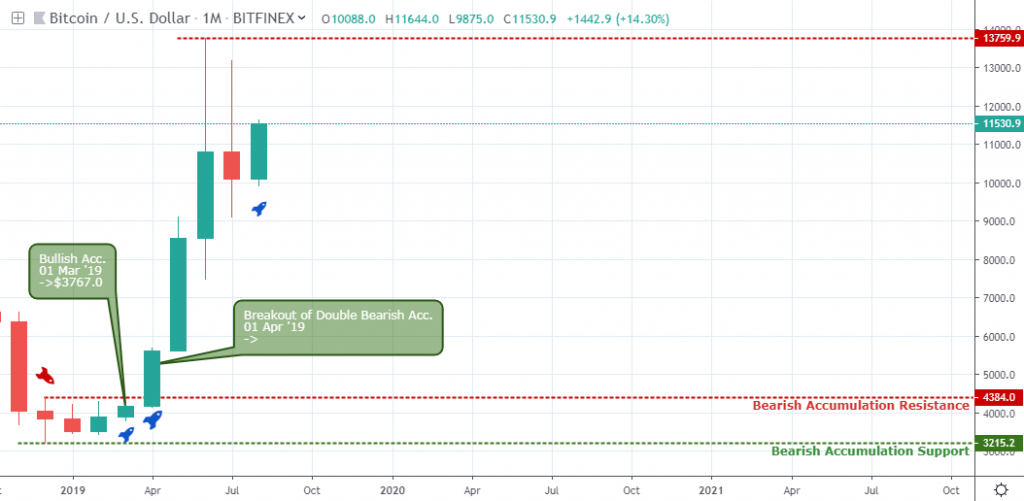
The Bitcoin price entered a series of consecutive bullish closing bars throughout the second quarter 2019 starting with the first month (April) signaling an increase in buying pressure as it coincides with a breakout of double bearish accumulation candlestick pattern. The buying frenzy continued as Chinese OTC traders did not mind paying a premium to get their hands on some Bitcoins.
BTCUSD: Weekly
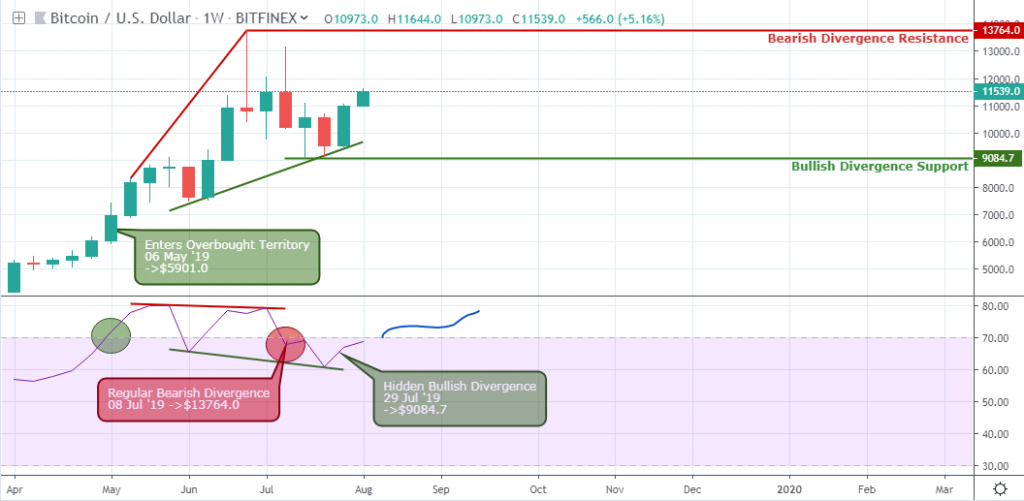
As the second quarter comes to a close, the weekly time frame signaled a regular bearish divergence pattern on July 08 ’19, the most prolonged price correction this year. At the end of Q2 and into Q3, the Relative Strength Index (RSI) forms a lower low compared to a higher low of the price, showing a hidden bullish divergence for a continuation of the bullish trend.
BTCUSD: Daily
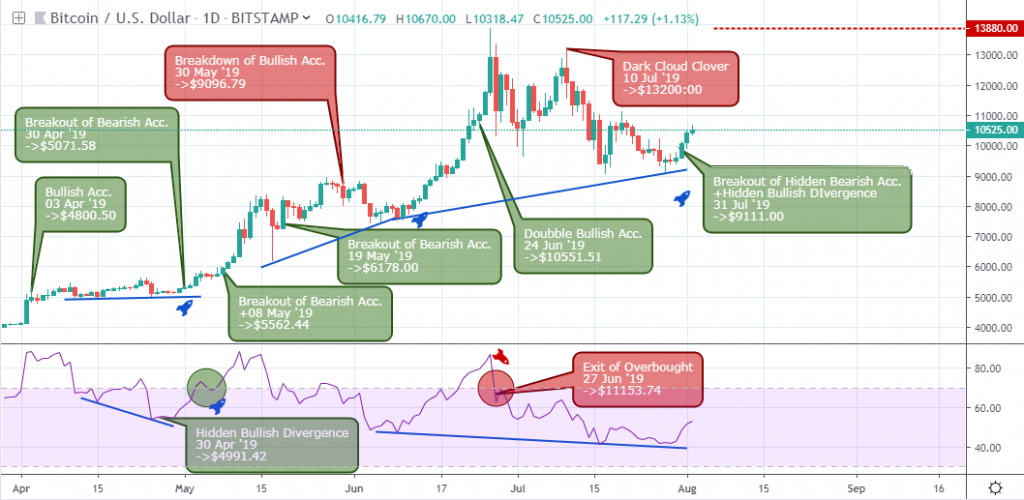
Bitcoin is in a strong bullish trend following a series of hidden bullish divergence patterns early Q2 on April 04 ‘19 through June 06 ‘19, and recently on July 31 ‘19.
A breakout of significant resistance established on July 27 ‘19 confirmed the current hidden bullish divergence pattern. Bitcoin price from the daily chart perspective formed higher troughs compared to the RSI oscillator with lower lows.
We look forward to the second quarter (Q2) high of $13200.00 as a significant target for taking the profit.
BTCUSD: 4-hour
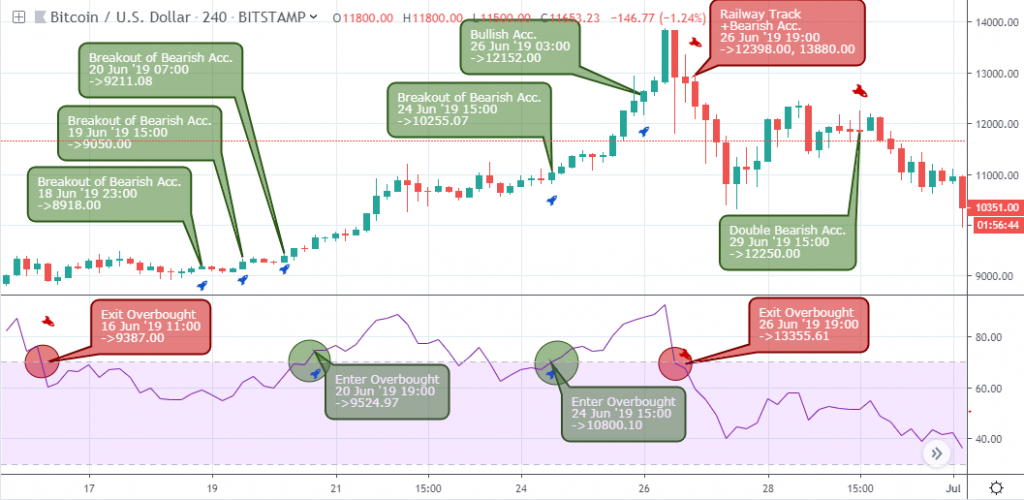
As we take a step lower to the 4-hour time frame, towards the end of the second quarter 2019, BTC price exited the overbought area on June 16 ’19 11:00 and entered a range-bound market formation.
Notice how the bearish accumulation resistance levels give way to buying pressure on June 18, 19, 20, and 24 ‘19, timely points to resume the bullish trend.
As the Bitcoin price enter the overbought territory on June 20 and June 24, the bulls added to their positions, forcing the price upward by about 15.0% and 25.4% respectively.
Rapid profit-taking and the formation of the bearish accumulation pattern on June 26 initialized the bullish trend correction as the price exits the overbought area.
Towards the last days of the second quarter Q2, the bears increased the selling pressure and established resistance at $12250.0.
Conclusion and Projection
Although the bullish trend saw a correction of earlier Q2 gains, expected hidden bullish divergence patterns on the daily and weekly trend should resume the bullish trend and a probable entry of the overbought area on the monthly time frame.
[/wlm_private]
Want to read the rest of the article? Join our pro-membership and receive all of the following:
✅Access to ALL content.
✅Access to the CTN editorial staff.
✅Access to our CTN trading dashboard.
✅Access to our exclusive telegram channel where all our pro-members and editorial staff are in.
✅Ability to request content/research material!
1 comment
[…] Bitcoin […]
Comments are closed.