
In the article Harmonic Price Patterns and Fibonacci Numbers for Crypto Trading, we promised to expand upon harmonic price patterns and what to look for when analyzing the crypto markets for profitable trading.
A Brief History
H.M. Gartley, wrote about a 5-point pattern (known as Gartley) in his book Profits in the Stock Market, which promoted revolutionary thinking as far as market analysis and predictions. Later improved by Larry Pesavento by using Fibonacci ratios to establish patterns, Scott Carney is credited with additional pattern theories like “ABCD”, “Three Drive”, “Crab”, and “Bat”, among others.
While running his stock market advisory service in the mid-1930s, Harold McKinley discovered the Gartley pattern. Because of their early success using these models, his service was among the early adopters of statistical and scientific methods towards analyzing the behavior of the stock market.
It wasn’t long before other traders realized that the pattern was found in other markets like the FX market, and it stands to reason that the harmonic patterns would also help in the analysis within the cryptocurrency markets as well.
Let’s examine some of the most popular harmonic patterns.
[rml_read_more]
ABCD Pattern
One popular pattern is ABCD. It uses the Swing High or Swing Low and the pattern creates something that looks like the letter “M” for bullish markets, and “W” for bearish markets.
They are great for guiding cryptocurrency traders into the global trend direction.
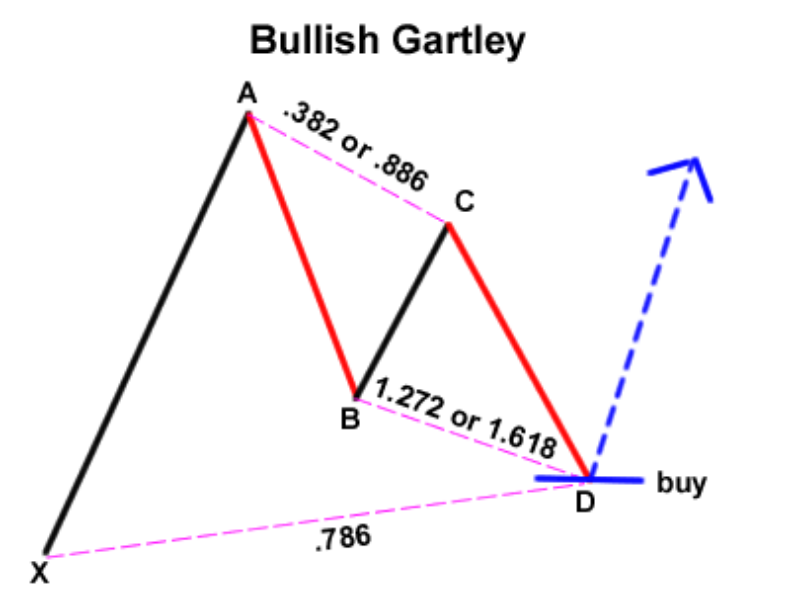
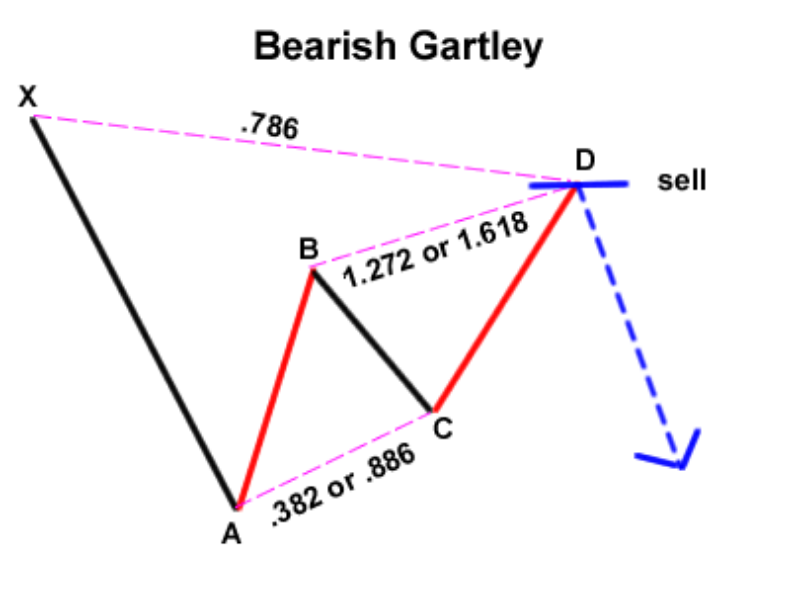
The Ideal Gartley pattern has the following features:
- The Impulse wave AB in the ABCD formation is a 61.8% (0.618) retracement of the preceding wave XA.
- The correction wave BC in the ABCD formation should be 38.2 %( 0.382) or 88.6% (0.886) retracement of the Impulse wave AB.
If the correction wave (BC) is 38.2% of the impulse wave (AB), the next impulse wave (CD) should be 1.272 Fibonacci extension of the correction wave (BC).
On the other hand, if the correction wave (BC) is 88.6% retracement of the impulse wave (AB), then the next impulse wave (CD) should be at 1.618 Fibonacci extension.
The CD wave should, according to mathematical theory, retrace the XA wave by 78.6%.
Three-Drive Pattern
If you understand the ABCD pattern, then you’ll come to realize that the three drive is a lot similar to it, except that it has three impulse waves which we’ll refer to as drives and two correction, or retracement, waves.
The three-drive pattern is way much similar to the Elliot wave pattern given the use of three impulse waves and two correction waves.
To identify this pattern for your own market analysis, deploy the Fibonacci or Three Drive tool on your favorite trade analysis site. We provide an example below in order for you to follow the trend and see what to look for.
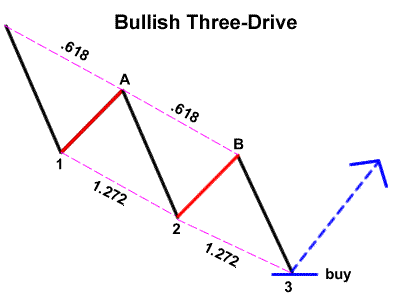
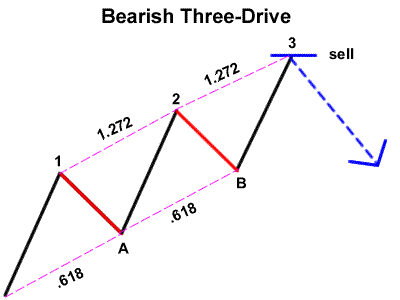
From the above chart, correction wave 1-A should be 61.8% retracement of Drive 1 (impulse wave X-1).
Correction wave 2-B should also be 61.8% retracement of Drive 2 (Impulse wave A-2).
Drive-2 (Impulse wave A-2) should be the 1.272 Fibonacci extension of correction wave 1-A, and Drive-3 (Impulse wave B-3) should be the 1.272 extensions of correction wave 2-B.
Considering that Drive-3 is a Fibonacci extension of correction wave 2-B, you can set your pending long or short entry order at the 1.272 Fibonacci extension with a measured amount of risk exposure.
To further fortify this setup, it is essential to run a time-based check on the correction and drives as a way to validate the pattern.
The time taken by the price to complete Drive-2 should be equal to the time taken to complete Drive-3. Then the time taken to complete correction waves 1-A and 2-B should be the same.
Crab Pattern
In the early 2000s, Scott Carney then discovered the “Crab” and “Bat” patterns.
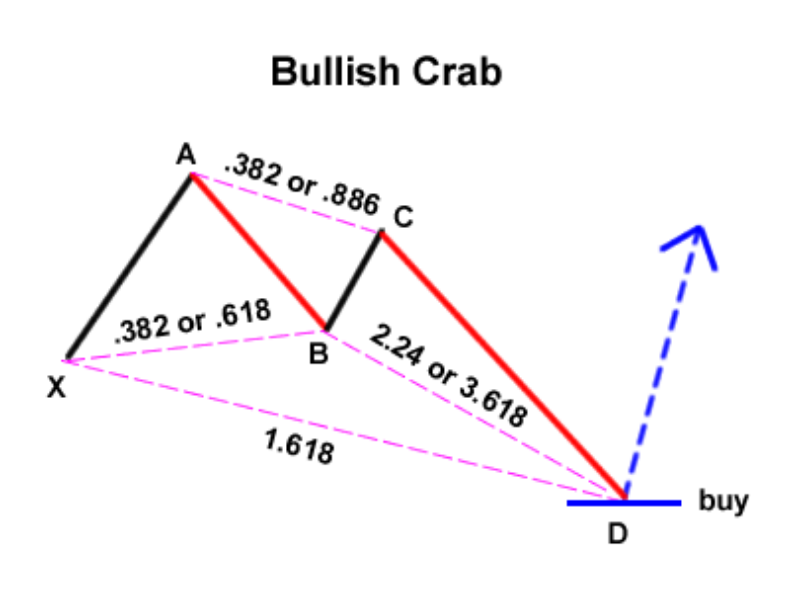
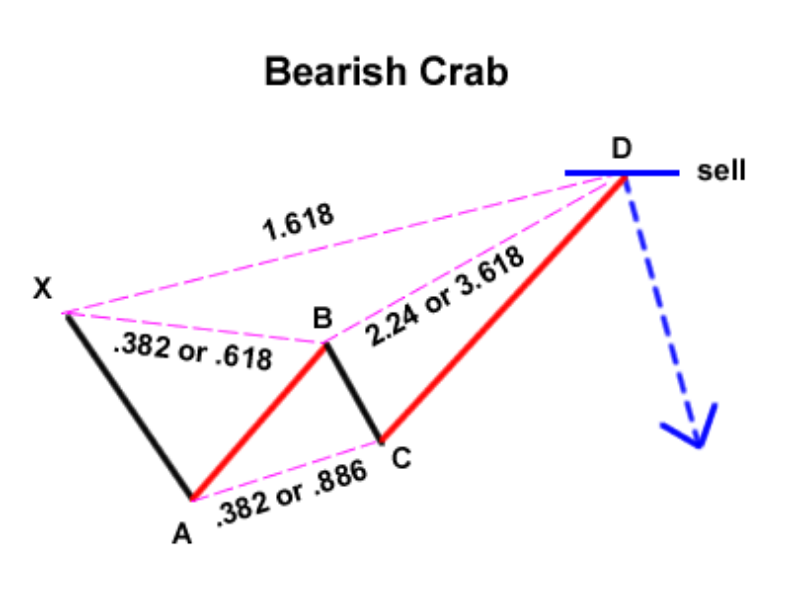
The typical crab pattern must have the following features:
- The Impulse wave (AB) should be 38.2% (0.382) or 61.8% (0.682) of wave XA.
- The Correction wave (BC) should be 38.2 % (0.382) or 88.6 % (0.886) retracement of the Impulse wave (AB).
- If the correction wave (BC) is 38.2 % (0.382) of the Impulse wave (AB), then the Impulse wave (CD) should be 2.24 Fibonacci extension of wave BC.
On the other hand, if the correction wave (BC) is 88.6 % (0.886) of wave AB, then the next Impulse wave (CD) should be 3.618 Fibonacci extension of wave BC.
The CD wave can then be predicted at 1.618 Fibonacci extension of wave XA.
Bat Pattern
This is another Harmonic price pattern discovered by Scott Carney.
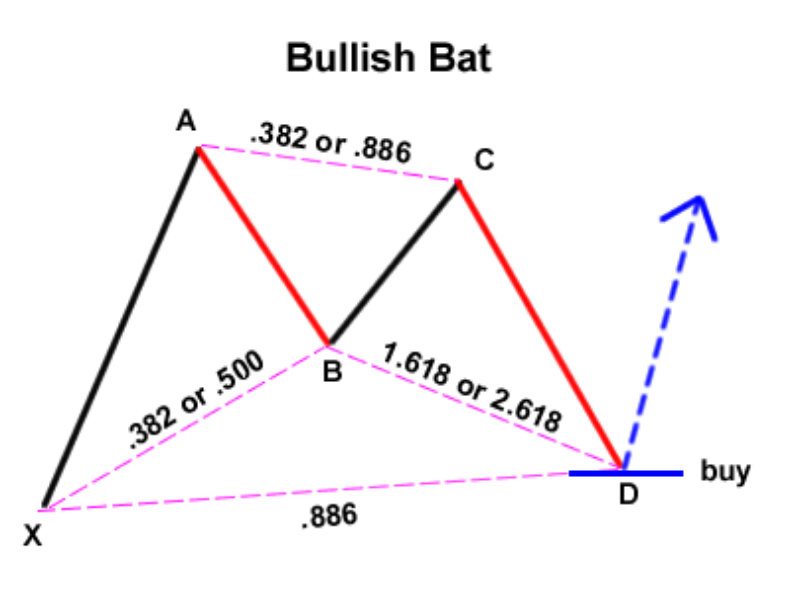
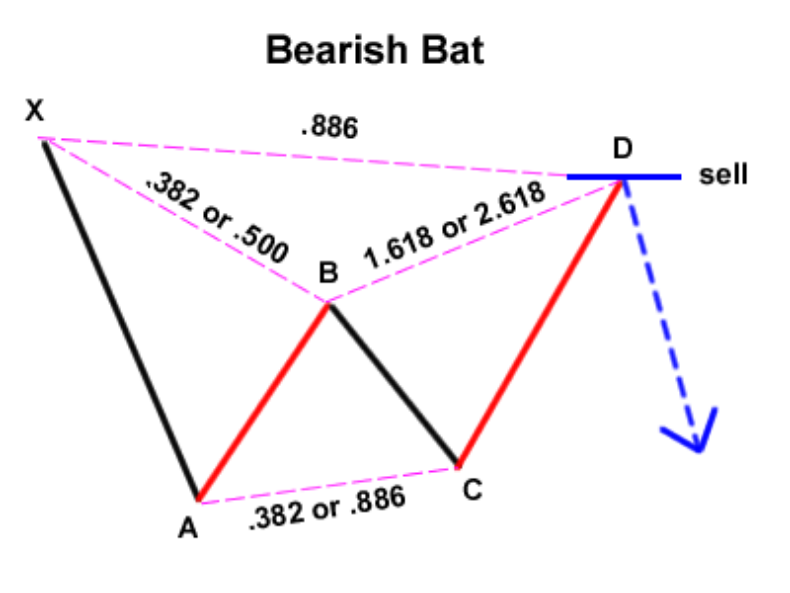
The 88.6 % (0.886) retracement of wave XA is a crucial reversal area for the Bat pattern.
The following features must be fulfilled for a pattern to be confirmed as a Bat:
- The impulse wave (AB) should be 38.2 % (0.382) or 50% (0.50) retracement of the significant wave XA.
- The correction wave (BC) can be one of the 38.2 % (0.382) or 88.6 % (0.886) retracement of the impulse wave (AB).
- If the correction wave (BC) is 38.2% (0.382) of wave AB, then the next impulse wave (CD) should be 1.618 Fibonacci extension of wave BC. On the other hand, if the correction wave (BC) is 88.6% (0.886) of the impulse wave (AB), then the next impulse wave (CD) should be 2.618 Fibonacci extension of wave BC.
The CD wave could then be predicted to be 88.6% (0.886) of wave XA.
It’s important to note that these patterns are dictated by mathematics and known history in the trading markets, but the risk comes from the human equation. Whether it is traditional or cryptocurrency trade markets, your best chance of creating a profitable portfolio is to first do the research and make smart decisions on your findings.
Disclaimer
Content provided by CryptoTraderNews is for informational purposes only, and should not be construed as legal, tax, investment, financial, or other advice. All information is of a general nature. As always, there is risk with any investment. In exchange for using our products and services, you agree not to hold CryptoTraderNews Pro, its affiliates, or any third party service provider liable for any possible claim for damages arising from decisions you make based on information made available to you through our services.