
In a social media debate with CNBC Joe Kernen on August 20, gold bug, Peter Schiff projected the price of gold will reach $5,000. Schiff, who had advised Joe to buy gold at a CNBC meeting before the 2008 financial crisis, was correct in his decision to long gold, while Joe was wrong to be bearish on gold.
[wlm_private “Crypto Trader Pro – Monthly|Crypto Trader Pro – Yearly|Crypto Trader Pro (Lite)”]
Meanwhile, another popular CNBC guest, Tom Lee, co-Founder of Fundstrat Global Advisors, described Schiff’s gold prediction as hysterical. In this post, we identify the technical chart pattern driving the price over time and the likelihood of the recent bullish rally.
Long term Price Overview
XAUUSD Monthly
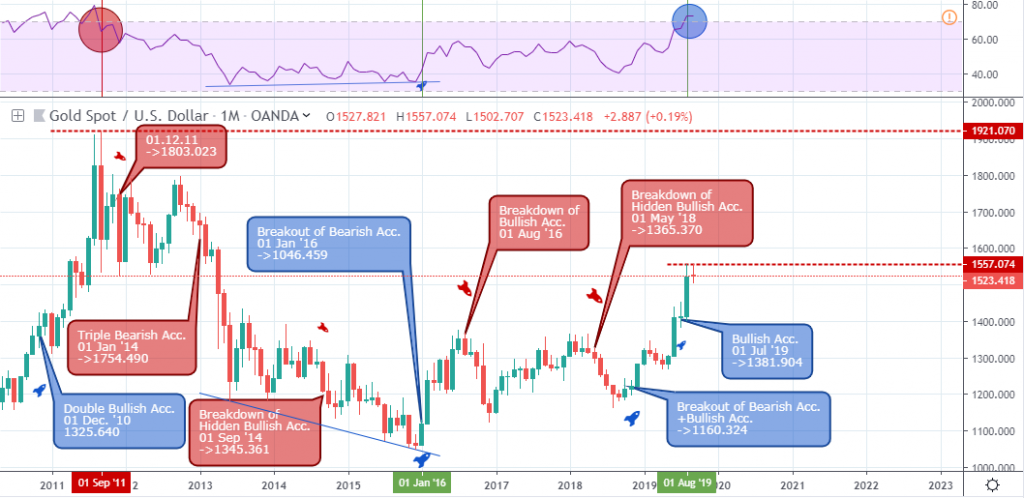
XAUUSD from a monthly time frame comes out of its longest bearish trend that lasted about 52-months by signaling a regular bullish divergence pattern in combination with a breakout of bearish accumulation on January 01 ’16.
After the regular bullish divergence pattern, and established peaks on August 01 ’16 and May 01 ’18, bullish momentum increased on October 01 ’18 from a breakout of bearish accumulation and hidden bullish divergence.
The price of gold has so far increased by 27.8% from the hidden bullish divergence pattern on October 01 ’18.
Possible Price Scenario
Upon entering the overbought area, the gold price should sustain its bullish rally. However, an exit of the RSI level-70 may confirm a drop in bullish momentum and signal correction of the gains, or perhaps a switch to a bullish trend.
XAUUSD Weekly
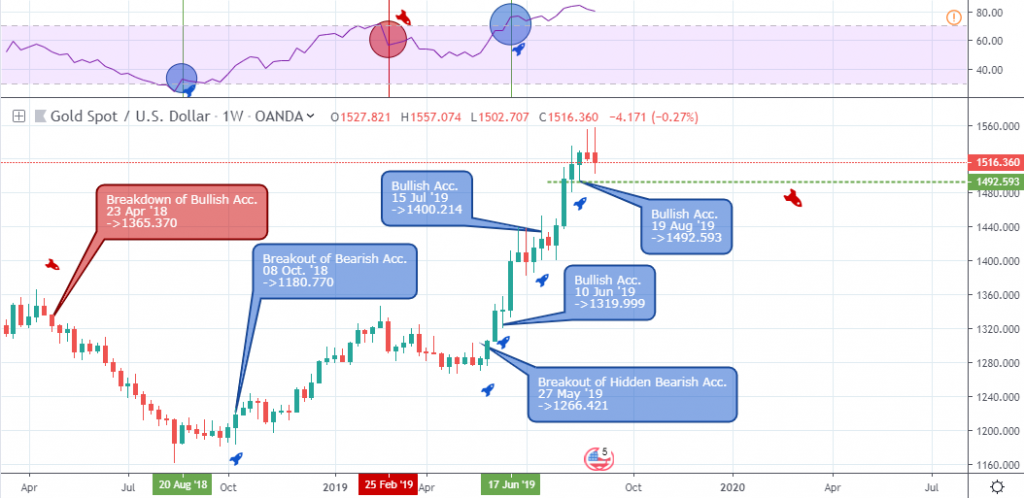
A breakdown of bullish accumulation on April 23 ’18 confirmed the 12.2% price decline before an opposite breakout of bearish accumulation started the bullish trend as the price of gold came out of the oversold area on October 08 ’18.
The chart also features a rejection of bearish pressure on May 27 ’19 and an increase in buying power on June 10, July 15, and recently on August 19.
Possible Scenario on the Weekly Time Frame
At the moment, the XAUUSD is in a bullish trend from a weekly time frame after entering the overbought area on June 07 ’19. It will flag the correction of the bullish trend upon a breakdown of the August 19 ’19 bullish accumulation support at $1,492.593.
XAUUSD Daily
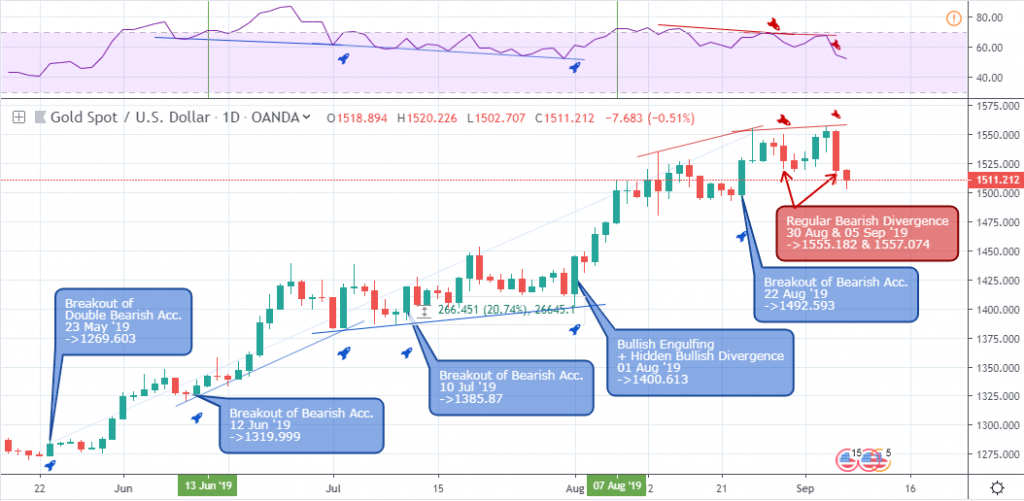
The daily chart shows the mid-term horizon of the XAUUSD, which has been in a bullish trend since the breakout of bearish accumulation on May 23 ’19 at $1,269.603. The effort to resume a price descent failed to increase in bullish pressure on June 12 ’19, July 10 ’19, August 01 ’19, and August 22 ’19.
Notice how the hidden bullish divergence patterns on July 02 and August 01 show a continuation of the bullish trend, and how the regular bearish divergence pattern signal profit-taking on August 30 and September 05.
Possible Scenario on the Daily Time Frame
A collapse of the $1,492.593 support will confirm a decision for an in-depth price plunge as the price exits the overbought zone while flagging bearish divergence setups. If the price closes above the $1,557.074 resistance, then the bullish trend is re-established.
XAUUSD 4-hour
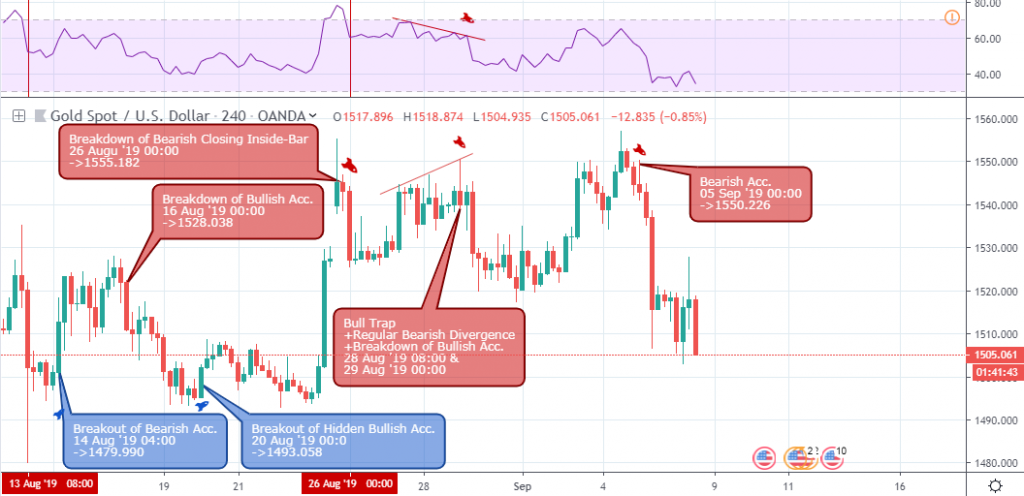
Rounding up with the 4-hour time frame, the gold price offers both bullish and bearish swing trading options mainly on August 14 ’19 04:00, and August 28 ‘19 08:00. The breakdown of bullish accumulation support at $1,510.96 points to further decline in the price of gold on an intraday level.
Conclusion
The price of gold reaching the $5,000 mark soon is bleak as the safe-haven commodity still trades at a local annual high of $1,557.074 way below the all-time high of $1,921.07. A general long-term overview of the XAUUSD points towards a continuation of the bullish trend.
Disclaimer
Content provided by CryptoTraderNews is for informational purposes only, and should not be construed as legal, tax, investment, financial, or other advice. All information is of a general nature. As always, there is risk with any investment. In exchange for using our products and services, you agree not to hold CryptoTraderNews Pro, its affiliates, or any third party service provider liable for any possible claim for damages arising from decisions you make based on information made available to you through our services.
[/wlm_private]
Want to read the rest of the article? Join our pro-membership and receive all of the following:
✅Access to ALL content.
✅Access to the CTN editorial staff.
✅Access to our CTN trading dashboard.
✅Access to our exclusive telegram channel where all our pro-members and editorial staff are in.
✅Ability to request content/research material!