There are two major types of analyses that, if combined properly, can help you determine market direction and entry points. These are fundamental, which considers macroeconomic indicators and technical analysis, and considers patterns on the time series charts.
Technical analysis, which has been popular for decades in the traditional FX market, is known to work on the cryptocurrency market. However, not every technical pattern is great for market timing as most of them have highly lagging indicators. We will attempt to show you the price action-based patterns that we consider to offer good and timely signals.
These patterns are as follows:
- Bullish Regular Divergence
- Bearish Regular Divergence
- Bearish Hidden Divergence
- Bullish Hidden Divergence
- Bullish Accumulation
- Bearish Accumulation
- Breakout of Bearish Accumulation
- Breakdown of Bullish Accumulation
[rml_read_more]
Bullish Regular Divergence
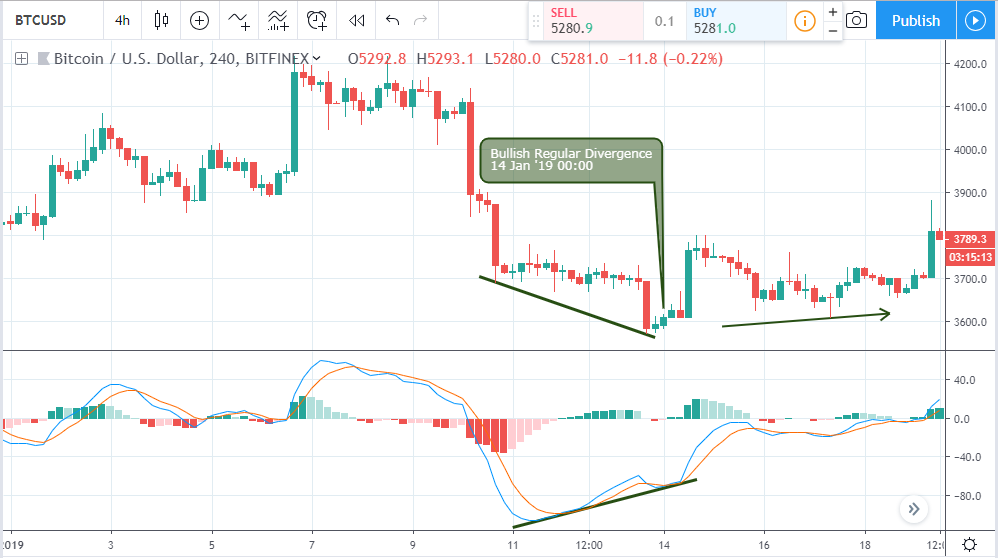
This pattern compares the lows of price to the MACD (9, 21, and 5) oscillator. If the price chart is making lower lows, while the MACD is making a higher low, a regular bullish divergence is triggered as shown on the image above.
Bearish Regular Divergence
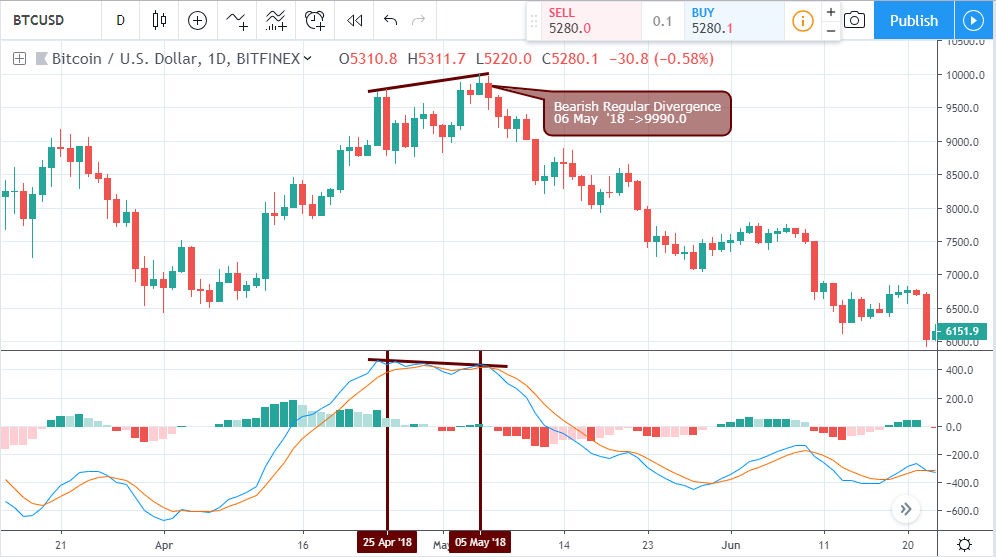
The bearish regular divergence pattern is opposite of the bullish variant. In this scenario, the price chart is making higher highs while the MACD oscillator makes lower highs as shown with the trend lines on the above chart.
Bullish Hidden Divergence
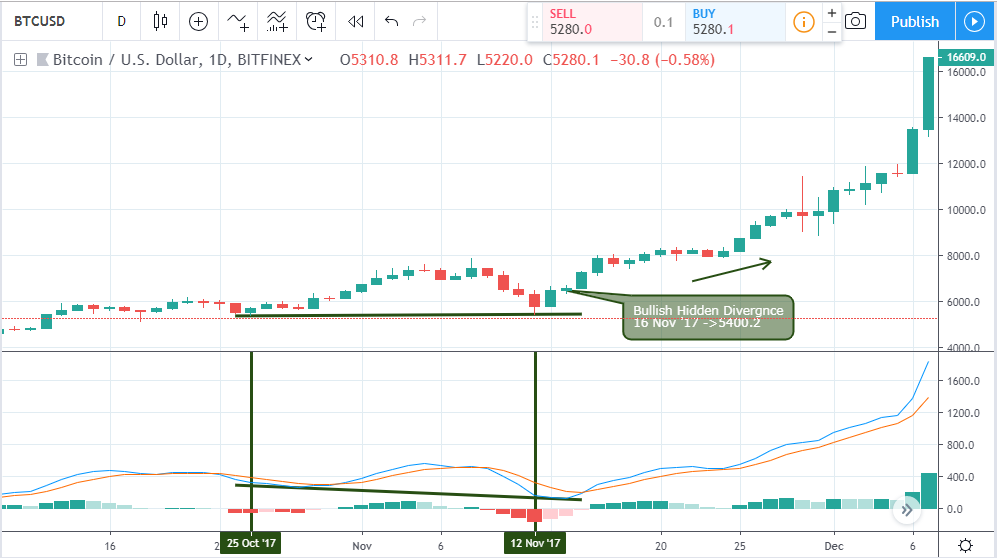
This divergence setup triggers bullish trend continuation by comparing the lows of price to the lows of the MACD oscillator. Shown with trend lines on the above chart, if the price chart is making higher lows, while the MACD makes lower lows, a bullish hidden divergence is triggered.
Bearish Hidden Divergence
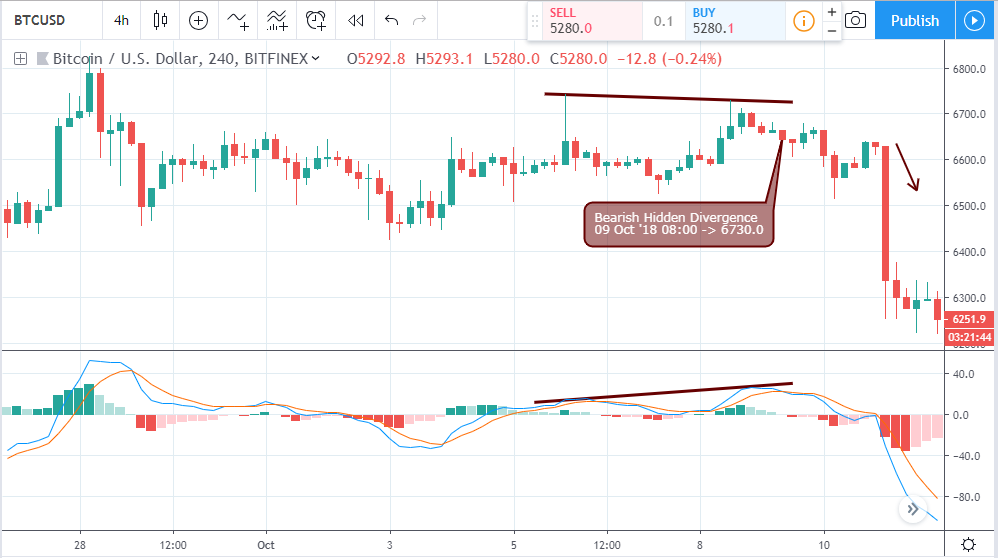
A bearish hidden divergence shows a continuation of a bearish trend, where the price chart makes lower highs, compared to the MACD higher highs as shown with trend lines on the above chart.
Bullish Accumulation
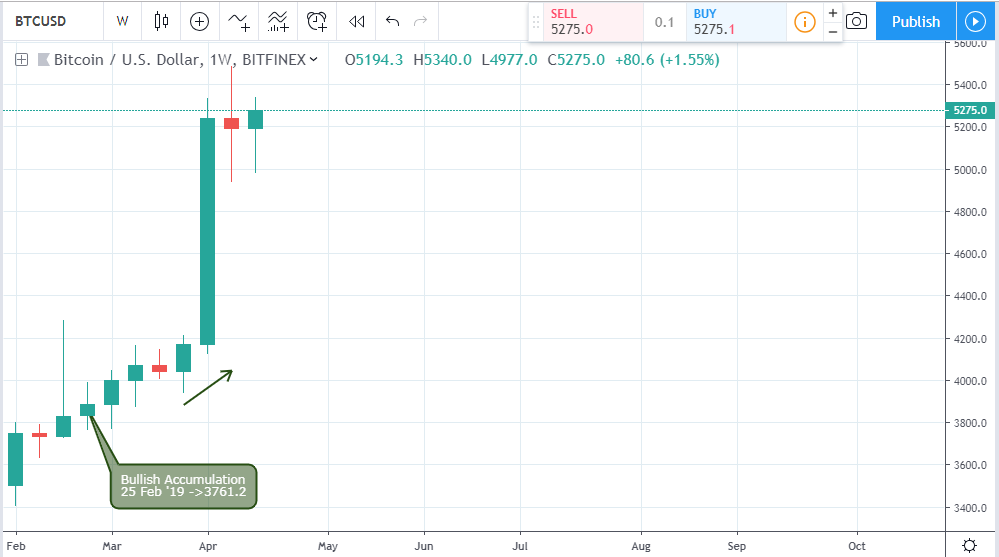
This pattern illustrates bullish pressure and it’s triggered when a child bar closes bullish similar to the mother bar, but within the high low range of the mother bar as shown on the chart above.
Bearish Accumulation
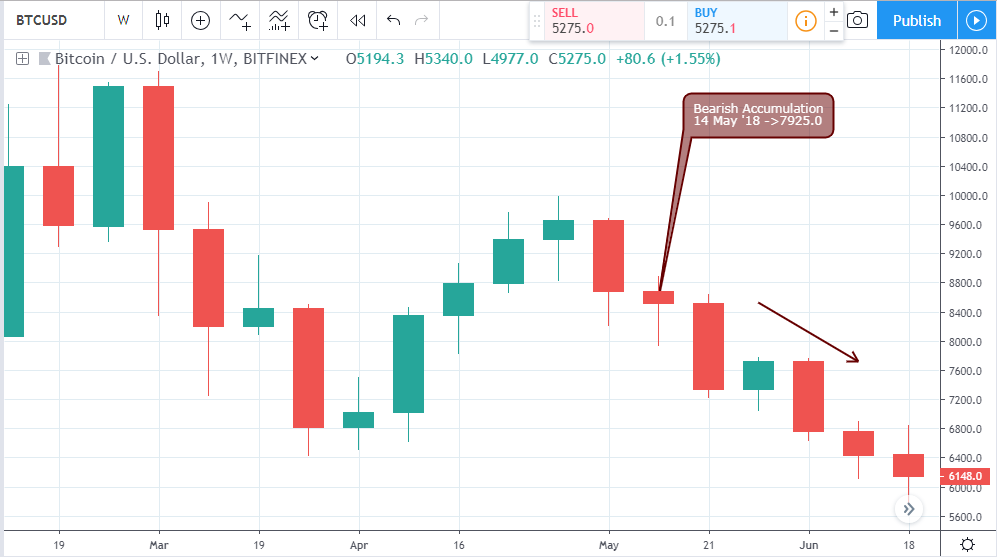
The bearish variant, as shown above, shows the child bar closing bearish similar to the mother bar, and within the high low range of the mother bar.
Double Bullish Accumulation
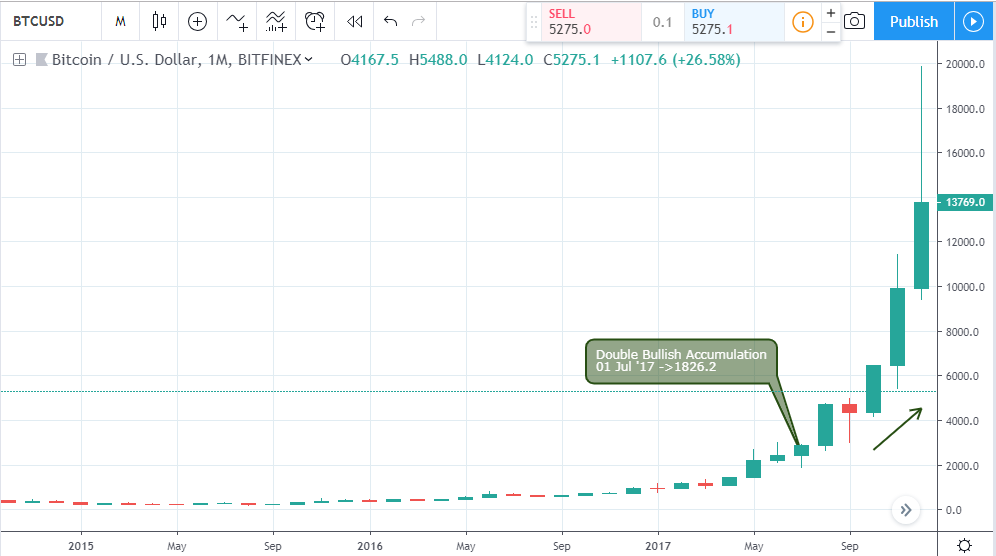
This price pattern illustrates a sequential formation of bullish accumulation patterns where each individual child bar closes within the high low range of the mother bar. It indicates higher bullish pressure compared to the single bullish variant.
Double Bearish Accumulation
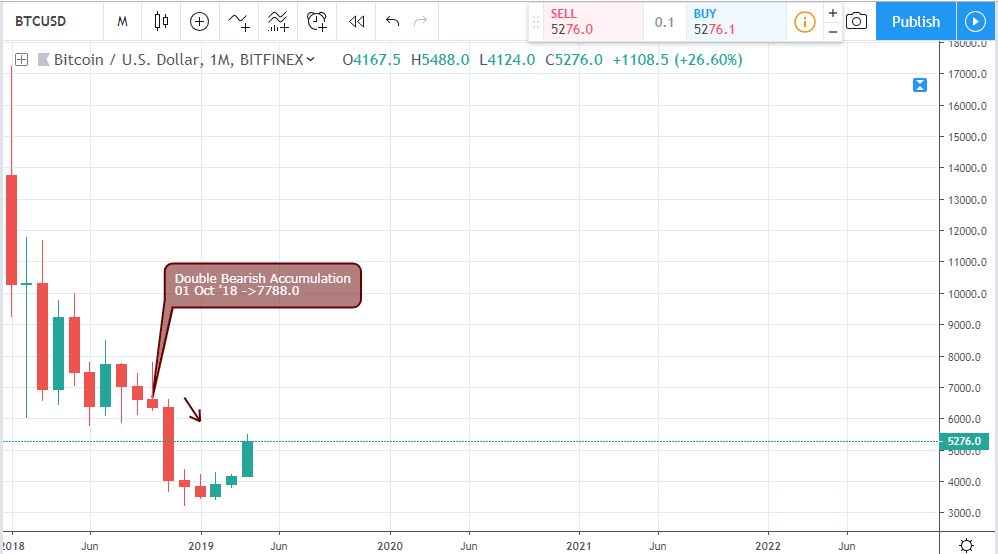
Like the double bullish variant, this pattern inversely shows higher bearish sentiment where individual child bars close within the high low range of their parent bars in sequence.
Breakdown of Bullish Accumulation
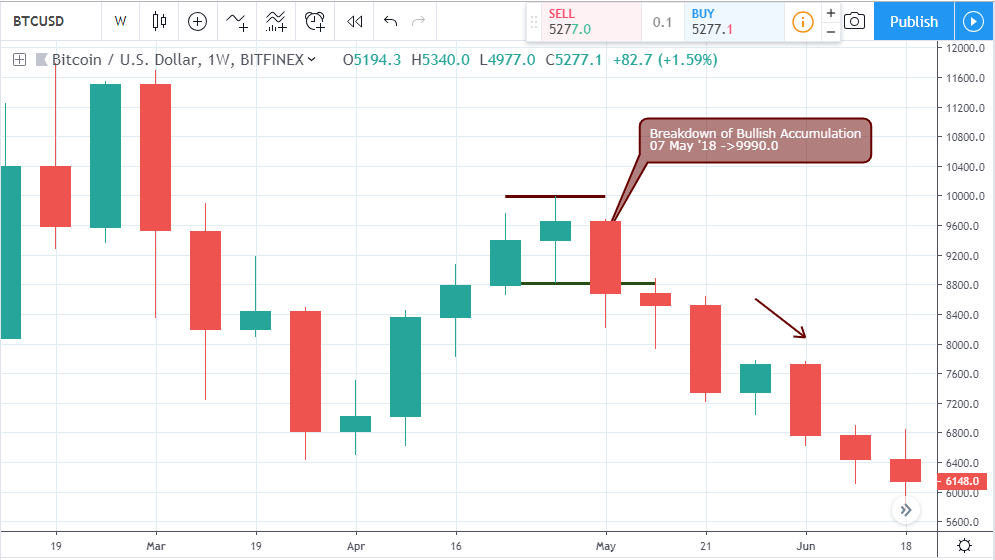
Bearish or bullish accumulation patterns do not always succeed in driving price in the same direction, sometimes it fails. These failures usually launch a new pattern.
The breakdown of bullish accumulation is flagged when the price closes below the low of the bullish child bar, thereby indicating rejection of bullish sentiment.
Breakout of Bearish Accumulation
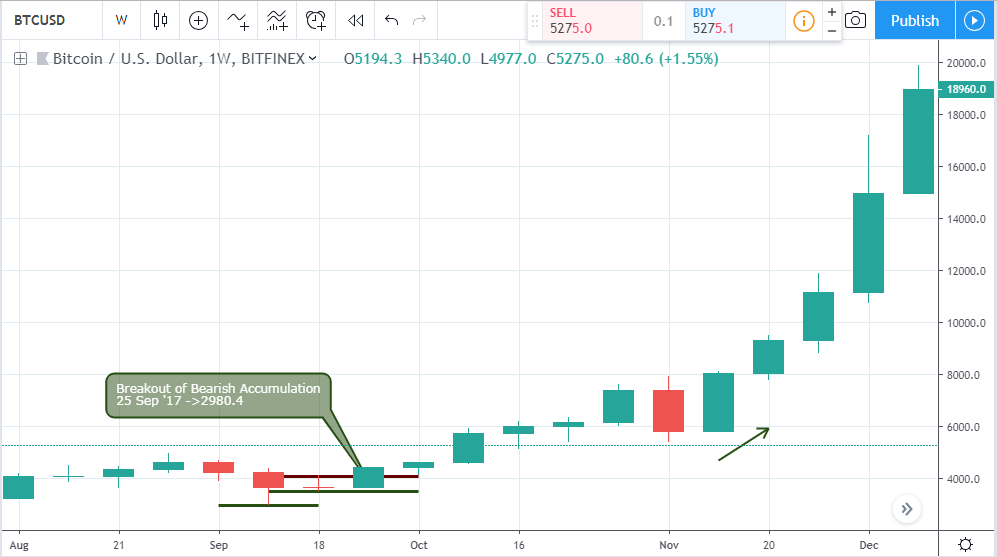
Opposite to the breakout of bullish accumulation is a breakout of bearish accumulation which indicates a failure of bearish pressure as shown on the above chart, and currently on the monthly chart of the BTCUSD.
This pattern is flagged when a bullish closing candles breach the child bar resistance level of the bearish accumulation pattern, as an indication of an increase in bullish pressure/volatility.
Conclusion
These patterns and setups are often triggered in the price time series charts of cryptocurrencies. When divergence and accumulation patterns are used in combination, a highly probable trade result is expected. Also be mindful that no trading tool, indicator or machine for that matter can guarantee 100% efficiency. However, with a high risk to reward to risk ratio of about 2.0 and price patterns that work above 60% of the time such as these you are on the right track to attain trading success.
Next, we’ll be introducing Harmonic patterns and how they can also be introduced in your trading arsenal.
Ensure to deploy protective stops when using any of these patterns as a form of risk management.
Disclaimer
Content provided by CryptoTraderNews is for informational purposes only, and should not be construed as legal, tax, investment, financial, or other advice. All information is of a general nature. As always, there is risk with any investment. In exchange for using our products and services, you agree not to hold CryptoTraderNews Pro, its affiliates, or any third party service provider liable for any possible claim for damages arising from decisions you make based on information made available to you through our services.