When it comes to investing, finding tools to better your chances of earning profits is critical to financial well-being. While some people give a passing glance to trading patterns, knowing what you’re looking at and taking a lot of the guess-work out is vital to smart trading decisions.
Oscillators
As a technical analysis tool, an oscillator is central to pooling extreme values to then discover trends from those results. This can include interpretations of short-term overbought or oversold conditions by seeing the lower extreme of the trend and making market analysis predictions based on that.
Oscillators are not often used by themselves but rather in conjunction with other technical analysis indicators. It’s that little extra bit of information that can be used when trends are not clearly visible, like if the markets are moving sideways or horizontally within a time period where the one-directional movement make prediction difficult.
While there are several types of oscillators, we will focus on MACD and RSI indicators.
[rml_read_more]
MACD Indicator
MACD is the acronym for Moving Average Convergence Divergence. It is a combination of moving averages used in identifying trends in bullish or bearish direction.
Similar to most oscillators, the MACD is a trend following momentum indicator between two moving averages in price, so the ease of identifying and riding trends is a major objective for traders because this can culminate into profits.
When attached to a cryptocurrency pair, the MACD indicator often appears at the sub-window below the crypto chart. While attaching the pair to your chart of choice, a display window presents you with the indicator settings where you input 4 values on the TradingView platform.
MACD Input Settings
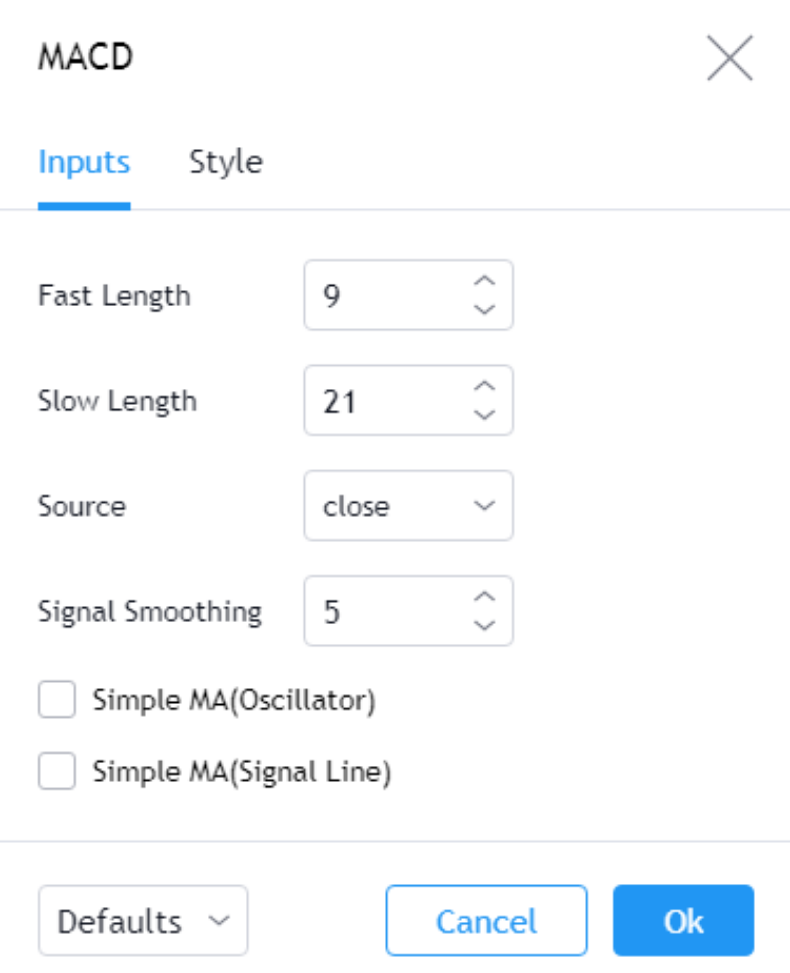
The first input field is for entering a numeric value for the length of Fast Moving Average followed by the input for Slow Moving Average. The third field is the source price which can be one of open, high, low, or close. The fourth field is the signal smoothing, which is the number of bars used in calculating the difference between the faster and slower moving averages.
Input the following parameters (12, 26, and 9) of the MACD, viewed as default settings on most charting platforms.
The first value, 12, shows the last 12 values of the fast moving average; 26 being the previous 26 bars of the slow moving average; the 9 is the last 9 bars of the difference between the two moving averages, plotted as a histogram on the same indicator sub-window.
Please note that both lines drawn on the MACD are not the moving average of the price, however, the moving averages of the difference between two moving averages.
We mentioned earlier that the default value for the MACD is the 12, 26, and 9. However, our preferred setting is (9, 21, 5) based on years of successfully trading traditional fiat currencies.
Note that both lines drawn on the MACD are not the Moving Average of the price, but rather the moving averages of the difference between two moving averages. Also of note: the histogram gets more significant as the moving averages move away from each other – this is called divergence.
Divergence is different from the popular divergence terms, which compare the peaks or troughs of price to the peaks or troughs of oscillators.
Convergence is when the moving averages come closer and the histogram becomes smaller.
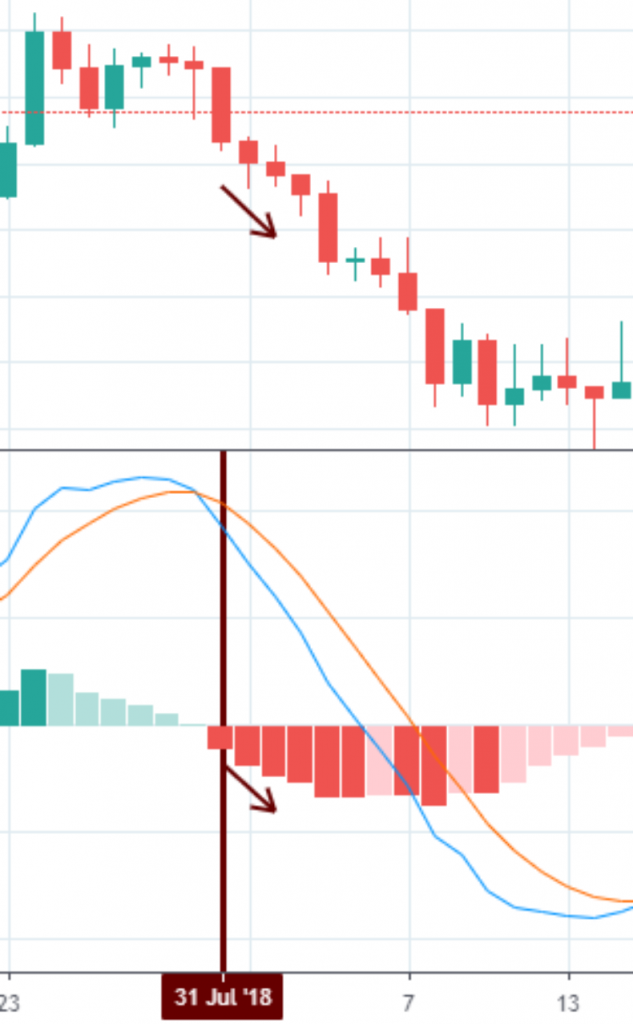
TRADING USING A CROSSOVER OF THE MACD
Considering that both moving averages of the MACD are at different speeds, traders often observe an upward and downward crossover of the fast and slow moving average.
MACD GOLDEN CROSS
When the fast moving average close above the slow moving average, it is called a Golden cross.

The above chart illustrates a golden cross of the MACD. Notice how the histogram expands after the cross over, indicating an increase in buying pressure.
MACD DEAD CROSS
A cross of the fast moving average below the slow moving average is called a Dead Cross.
The Relative Strength Index
RSI is an acronym for Relative Strength Index, a popular indicator that was developed by a technical analyst, J. Welles Wilder. This indicator enables traders to gauge the markets’ strength.
RSI Input Settings
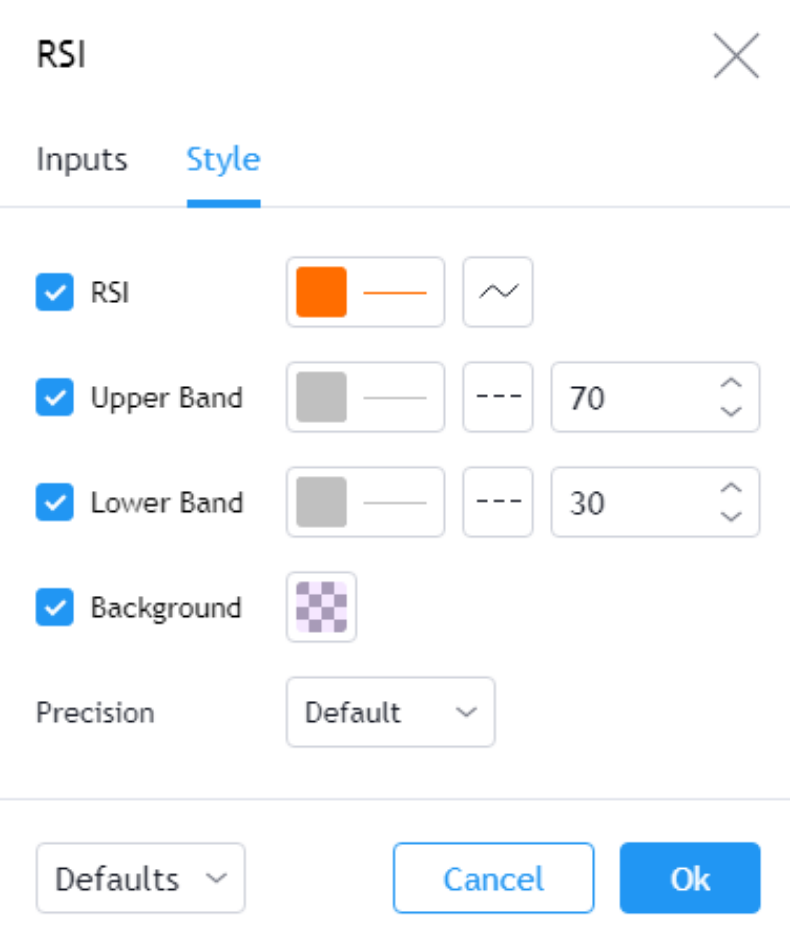
The RSI indicator is also an oscillator as it hovers between zero and one hundred boundaries, enabling traders to track an overbought or oversold nature of a crypto-asset.
RSI OVERBOUGHT AND OVERSOLD
When the RSI value falls below level-30, it shows a chance of price recoil in the upward direction — hence oversold.
RSI values above 70 show an overbought cryptocurrency price and possible price reversal.
But wait a minute… You might be wondering, does this mean that all oversold or oversold cryptocurrency prices imply an immediate price reversal in the opposite direction?
Not at all.

Signal to trade a reversal from an overbought position, as shown on the image above, is confirmed when the RSI crosses below the level-70 after crossing above it earlier.
The same applies to the RSI oversold, which is confirmed when the RSI crosses above the level 30 upward from below as shown on December 17 ’18.
An earlier cross below the level 30 on November 15 ’18 implies an increase in selling pressure and should not be considered as signal to buy. This is similar for an overbought scenario.
Detecting Trend with the RSI Level-50
Traders also pay attention to the center line at Level-50 as a way of measuring the strength of the trend.
If the RSI cross the level-50 from below and moves towards the level-70, this is viewed as a strong bullish trend. A cross from above the level-50 and headed towards the level-30 is viewed as a strong bearish trend.
You see, for RSI overbought or oversold setups to be effective, you have to use them in combination with price action patterns, or divergence patterns.
Overbought or oversold setups are useful when the crypto market is in a swing. When analyzing strong bullish or bearish trends, an RSI overbought or oversold could imply an increase in buying or selling pressure.
Disclaimer
Content provided by CryptoTraderNews is for informational purposes only, and should not be construed as legal, tax, investment, financial, or other advice. All information is of a general nature. As always, there is risk with any investment. In exchange for using our products and services, you agree not to hold CryptoTraderNews Pro, its affiliates, or any third party service provider liable for any possible claim for damages arising from decisions you make based on information made available to you through our services.