
The Bitcoin (BTC) price traded below the $10K level through the last days of August 2019 following an increase in sell orders and the collapse of significant support levels.
This week we analyze the technical chart patterns driving the price of BTC on the long and short term; identifying critical resistance level that must be breached for us to see further price advancements.
[wlm_private “Crypto Trader Pro – Monthly|Crypto Trader Pro – Yearly|Crypto Trader Pro (Lite)”]
Long-Term Price Overview
Following a top-down analysis of the BTCUSD, we start from the monthly time frame, where we point out the price dynamics at play and scenarios that may unfold in the coming month.
BTCUSD Monthly
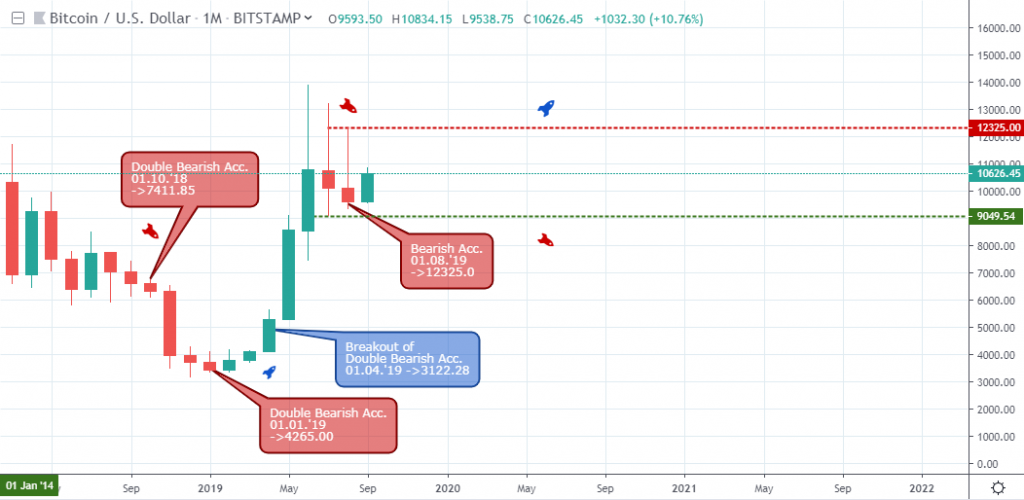
In the above chart, notice that the bearish accumulation patterns are the most significant price patterns at play. This break from the significant resistance levels, or a price breakdown, may establish the market trend in the coming weeks.
As August ended, the bears signaled a bearish accumulation pattern after closing at $9594.15 and setting resistance at $12,325.
Possible Price Scenario
A price close above the $12,325 resistance will confirm an end to the price correction and Bitcoin prices could surpass the all-time high of $19,666. The price may slump if the bulls do not exceed the significant resistance level of $12,325 from this time frame.
We move lower to the weekly time frame, where we may get early long or short trading opportunities.
BTCUSD Weekly
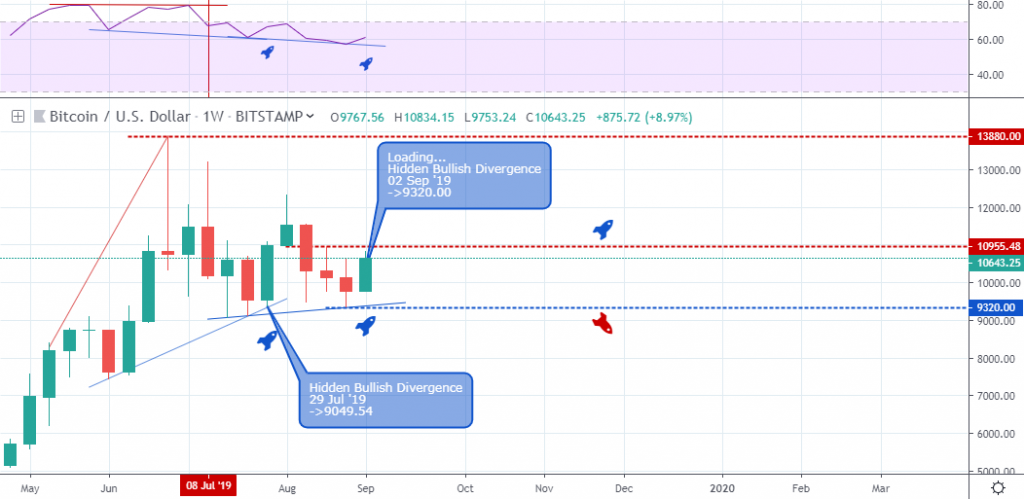
The weekly chart overview reveals BTCUSD trading in an expanding channel built by regular and bullish divergence patterns, as shown above.
Possible Scenario on the Weekly Time Frame
Last week’s bearish closing price confirmed a double bearish accumulation pattern similar to that of January 01 ’19 on the monthly time frame. The bearish formation shows a gathering of sellers, and a close above the $10,955.48 resistance should confirm a price hike.
Failure to attain a close above the significant weekly chart resistance may suggest a continuation of consecutive bearish closing bars.
BTCUSD Daily
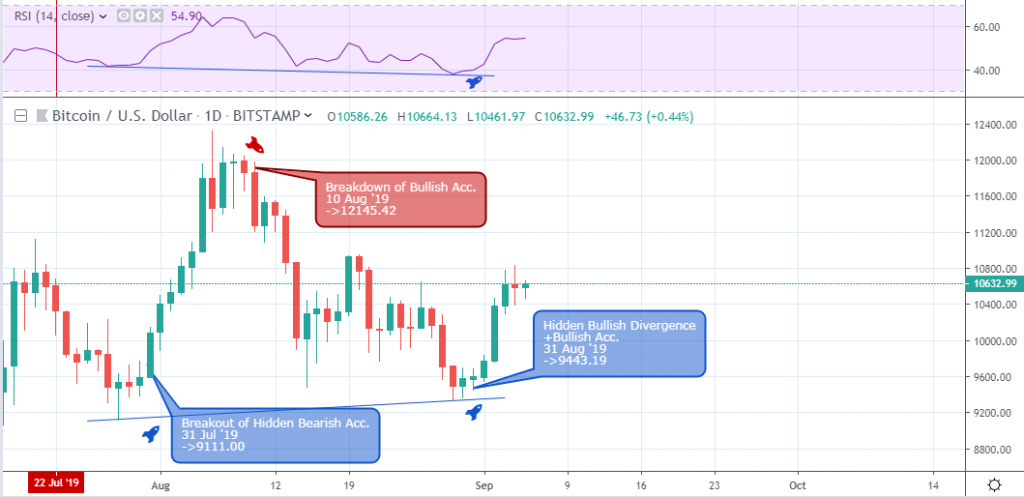
Accompanied by fear, uncertainty, and doubt, rejection of critical support on August 22 ’19 at $9,755.53 resulted in panic selling of BTC across exchanges.
A bullish accumulation price pattern on August 31 ’19 confirmed the hidden bullish divergence pattern and an upbeat swing into the first part of the week.
We notice a slowing of the initial bullish momentum as the price approach the $10,955.48 resistance identified on the weekly time frame.
Possible Scenario on the Daily Time Frame
Although the Bitcoin BTC price may have stalled around the identified daily chart resistance, a bearish price decline is not yet confirmed. However, a close above the $10955.48 resistance may emphasize an increase in the unfolding bullish campaign.
BTCUSD 4-hour
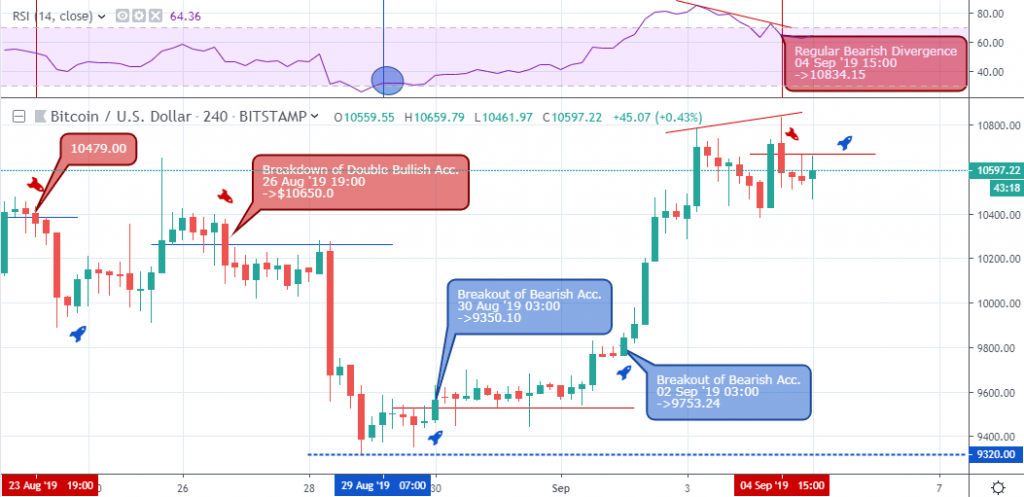
Bringing us to a closer view of the underlying patterns that brought BTC prices below the 10K level is the 4-hour chart.
Attempts to sustain consecutive bullish closing bars failed to an increase in selling pressure on August 23 ‘19 19:00. The second collapse of bullish support on August 26 ’19 19:00 finally brought the pair to a low at $9,350.10, an 8.25% price decline.
After setting the August price low at $9,320, bearish resistance levels give in to an increase in bullish momentum on August 30 ’19 03:00 and September 02 ‘19 03:00 for a price increase of about 13.4%.
Regular bearish divergence patterns flagged on September shows early take profit activity by bulls from the August 30 breakout point as the pair also exits the overbought area.
BTCUSD 1-hour
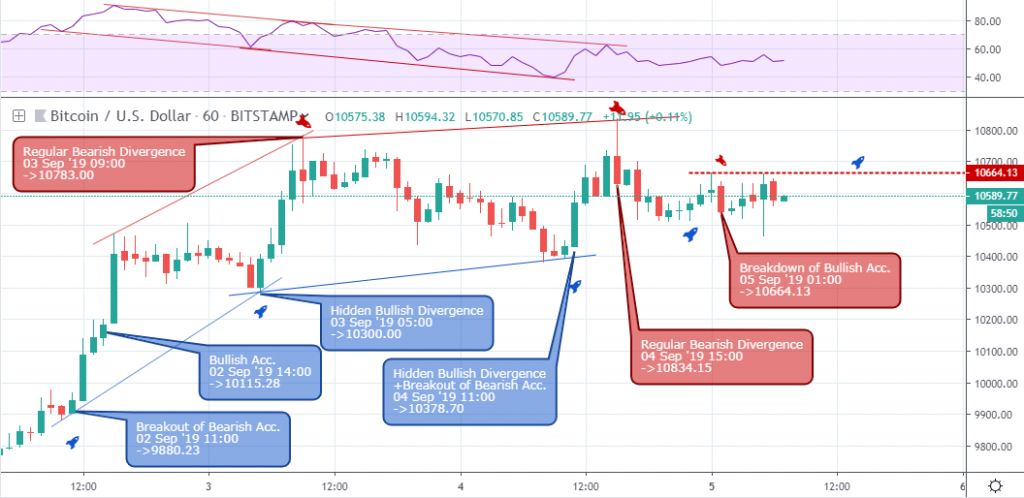
Rounding up with the intraday 1-hour time frame, BTCUSD resumed a bullish trend after the price dip below the $10K round number level. The formation of bearish and bullish divergence levels around the overbought zone shows a battle to take the price higher or force it lower.
Conclusion
The $10K round number level has acted as both a support and resistance zone since June ’19, with the price closing below the level twice on July 22 ’19 and last month, August 26 ’19, from a weekly time frame.
A close above the level this week will be the third time the price breach the scale to the upside with vast potentials of a rally. Additionally, the recent announcement of the Bitcoin ETF may drive the Bitcoin price above the $10,955.48 resistance – or ignite a price plunge.
Disclaimer
Content provided by CryptoTraderNews is for informational purposes only, and should not be construed as legal, tax, investment, financial, or other advice. All information is of a general nature. As always, there is risk with any investment. In exchange for using our products and services, you agree not to hold CryptoTraderNews Pro, its affiliates, or any third party service provider liable for any possible claim for damages arising from decisions you make based on information made available to you through our services.
[/wlm_private]
Want to read the rest of the article? Join our pro-membership and receive all of the following:
✅Access to ALL content.
✅Access to the CTN editorial staff.
✅Access to our CTN trading dashboard.
✅Access to our exclusive telegram channel where all our pro-members and editorial staff are in.
✅Ability to request content/research material!