
Bitcoin (BTC) price is in the most prolonged correction of about 34% after coming out of the 2018 crypto winter. This has prompted crypto analysts to compare the current price moves of BTC today to that of the November 2018-style price dump.
[wlm_private “Crypto Trader Pro – Monthly|Crypto Trader Pro – Yearly|Crypto Trader Pro (Lite)”]
Crypto analyst and co-founder of blockroots.com, Josh Rager, often tweets about Bitcoin and other crypto market outlooks and suggested the daily price close might stay above the $10,200 mark for strong bullish confidence.
A comparison to the November 2018 price dump is quite exaggerated as the Bitcoin price was in a clear long-term bearish trend then, we compared the price dynamics to January 2018, where the BTCUSD was correcting a similar price rally.
The monthly time frame below shows a double bearish accumulation candlestick pattern signaled at the time window (November ‘18).
Let’s enter our way-back time machine and compare the recent price correction to that of January 2018, starting from the daily time frame.
BTCUSD Daily – January 2018
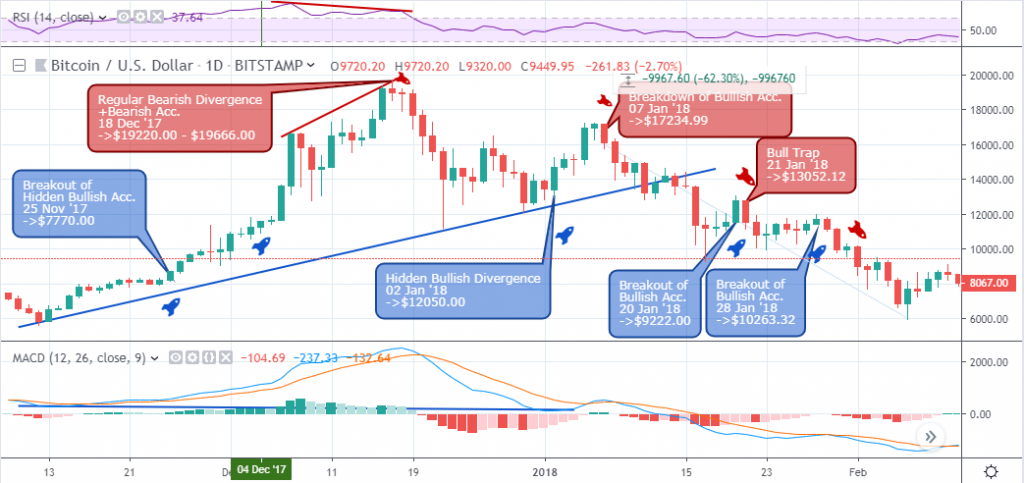
After exiting the overbought area and signaling a regular bearish divergence setup on December 18, 2017, which marked the all-time high of the BTCUSD, the Bitcoin price declined by about 40%. The bulls responded by signaling a hidden bullish divergence pattern on January 02, 2018.
Notice how the divergence pattern collapsed, beginning with an earlier breakdown of bullish accumulation on January 07, 2018. The bullish divergence trend line collapsed on January 15 ‘18 finally fueling roughly a 62.0% decline from the January 07 ‘18 price breakdown.
Below, we observe similar patterns to the January 2018 price collapse. Let’s check it out.
BTCUSD Daily July – August 2019
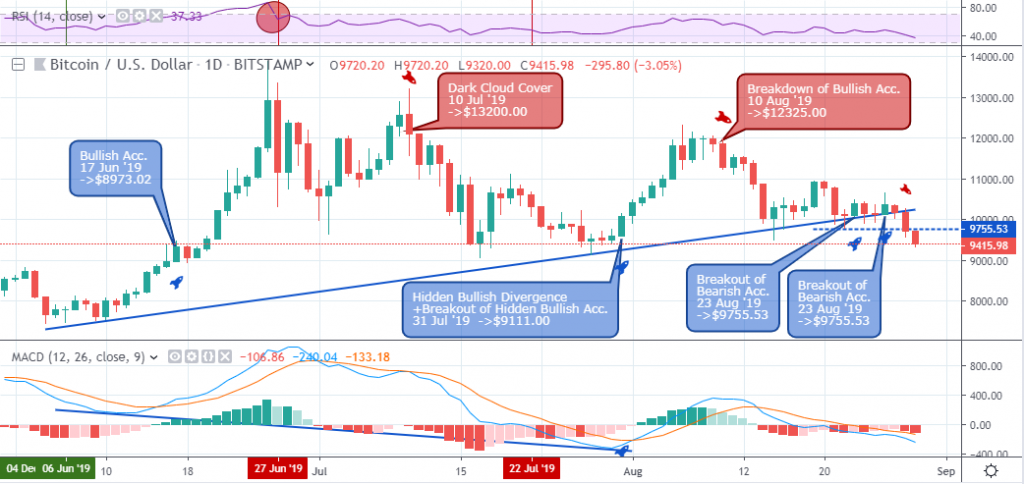
After establishing a peak at $13,880, the Bitcoin price exited the overbought area on June 27 ’19 and headed south for about 30% before springing back up to a high of $13,200.
The bitcoin price signals a hidden bullish divergence pattern and breaks below the bullish trend line similar to that of January 2018.
Sellers force the Bitcoin price below the significant support level ($9,755.53) established by a breakout of bearish accumulation on August 23 ’19.
The BTCUSD sets a low of $9,320 at publication time as the bears threaten the $9049.54 support level.
An eventual price close below the $9,049.54 support may spell doom for HODLers, and the Bitcoin price could suffer a similar fate as January 2018.
BTCUSD Weekly
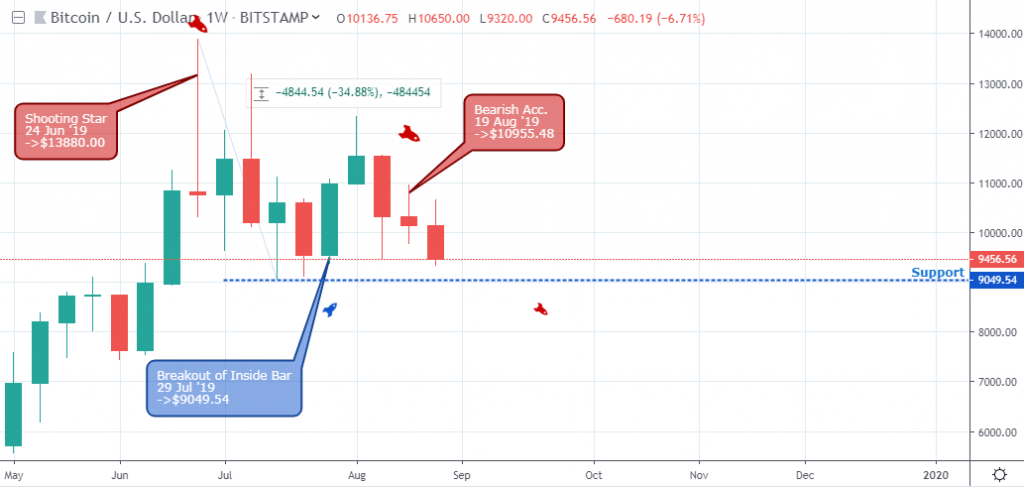
The bearish accumulation candlestick pattern signaled last week highlights an increase in selling pressure after setting up resistance at $10,955.48. It may be the boost needed for sellers to drive the BTC price south. However, a break below the $9,048.54 support from a weekly chart perspective should confirm a downward exit from the current range-bound phase.
BTCUSD Monthly
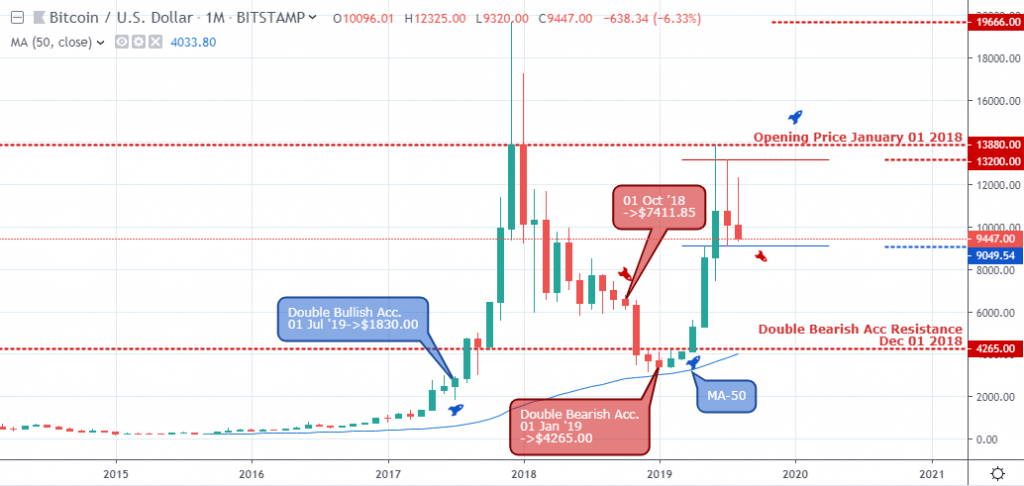
A strong reference point for the recent price correction is the $13,880 resistance established after the closing price of December 2018. The resistance level consequently led to a bearish closing inside bar price pattern last month of July 2019.
We consider the inside-bar price levels high $13,200 and low $9,049.54 excellent reference points for a price decline or increase.
A price close below or above either of these levels may clarify the long-term trend direction.
Conclusion
In this article, we’ve been able to establish a clear historical price window similar to the ongoing price correction and scenarios for price increase or decline. However, the monthly time frame still maintains a bullish outlook. We’ll keep tabs on the significant support level for a change in polarity as the month of August comes to a close.
Disclaimer
Content provided by CryptoTraderNews is for informational purposes only, and should not be construed as legal, tax, investment, financial, or other advice. All information is of a general nature. As always, there is risk with any investment. In exchange for using our products and services, you agree not to hold CryptoTraderNews Pro, its affiliates, or any third party service provider liable for any possible claim for damages arising from decisions you make based on information made available to you through our services.
[/wlm_private]
Want to read the rest of the article? Join our pro-membership and receive all of the following:
✅Access to ALL content.
✅Access to the CTN editorial staff.
✅Access to our CTN trading dashboard.
✅Access to our exclusive telegram channel where all our pro-members and editorial staff are in.
✅Ability to request content/research material!