
Following an increase in geopolitical uncertainties across the global markets, Bitcoin (BTC) became a haven for investors to hedge against risks on fiat currencies, which resulted in a hike on BTC prices, which flirted slightly above the $12K round-number support.
[wlm_private “Crypto Trader Pro – Monthly|Crypto Trader Pro – Yearly|Crypto Trader Pro (Lite)”]
As Washington delayed the introduction of some new trade tariffs, the US/China trade tension eased off which consequently reduced pressure on the Chinese Yuan. The recent global events have led to the Bitcoin price wandering around $11K. Speculators who paid a premium to purchase Bitcoin as a way of protecting their funds during a global crisis are beginning to take their foot off the gas pedal.
Let’s continue by carrying out a top-down analysis of the technical chart and price patterns that drove the Bitcoin price out of the $11K range, above all, how they interpret these recent fundamental developments.
BTCUSD Daily Chart
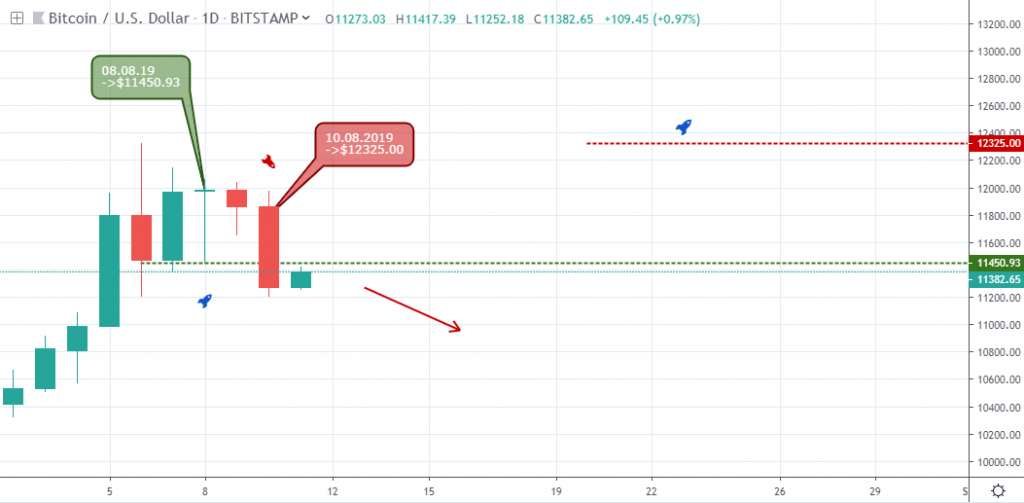
Earlier this week, the Bitcoin price broke below bullish accumulation support of $11450.93, showing a weakness of bullish momentum.
The number one cryptocurrency by market cap hovered around the $11,000.00 round number area as it showed further weakness into the week.
While putting this article together, an increase in selling power from the intraday level forced the Bitcoin BTC price below significant supports on the 4-hour and 2-hour time horizons as we’ll see below.
BTCUSD 4-hour
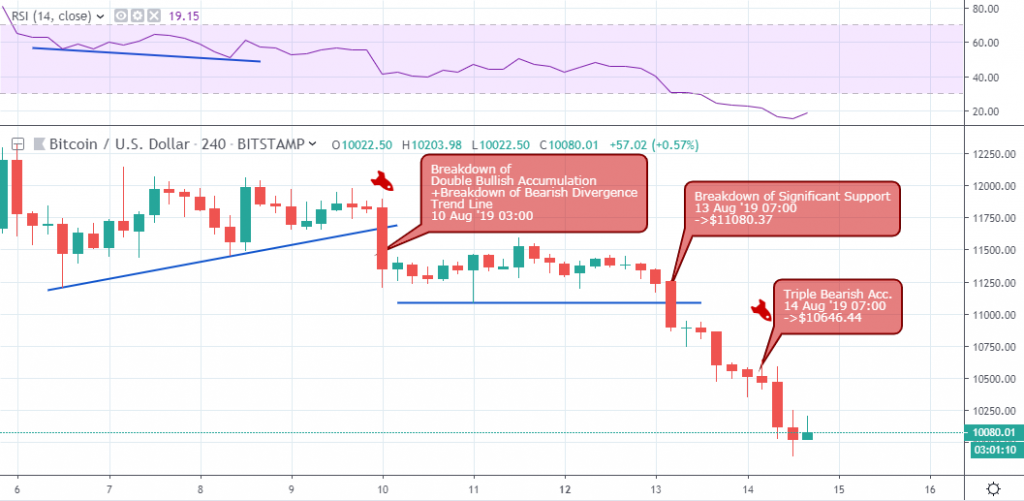
From a 4-hour time frame, we notice attempts by the bulls to continue the bullish campaign via a hidden bullish divergence pattern that later failed to a collapse of double bullish accumulation and trend line on August 10 03:00.
As the BTC price wanders around the $11K zone, the bears finally broke below hidden bullish accumulation support on August 13:00 07:00.
Moving away from the $11K zone, the BTCUSD chart signaled an increase in selling pressure on August 14 07:00 as the Bitcoin price plunged lower.
BTCUSD 2-hour
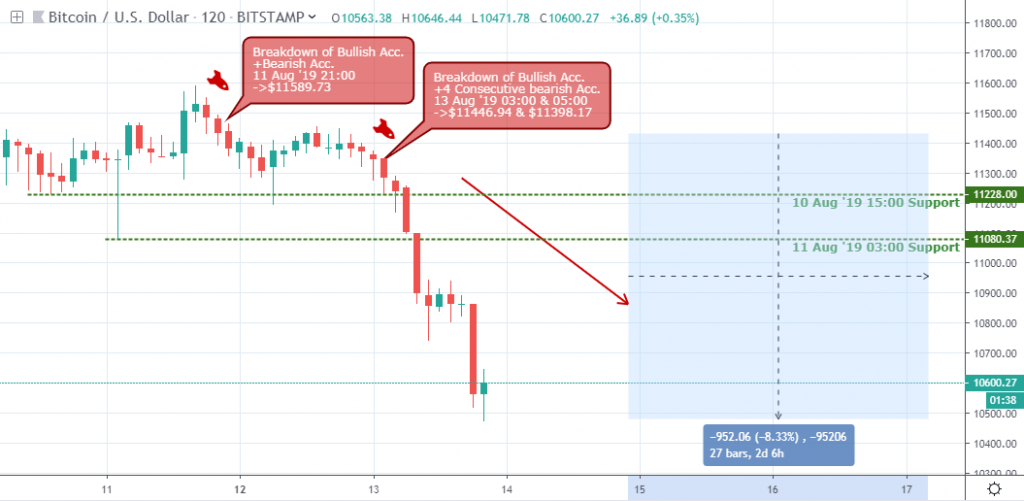
A view from the 2-hour chart lends a clearer perspective into the price breakdown out of the $11K range.
After attempts by the bulls on August 10 15:00, breaking out of bearish accumulation resistance further efforts to restore the price failed to sell pressure on August 11 21:00 and August 13 05:00.
The bullish support levels at $11,228.00, and $11,080.37 could not stand the test of time as the Bitcoin price came crashing down by about 8.33% while writing this post.
Conclusion
The Bitcoin price at press time trades below the monthly price open of $10096.01, about a 9% decline from the $11K round-number resistance.
Although there’s no technical chart pattern pointing to a reversal in the BTC price, we’ll be paying close attention to the daily time frame of the BTCUSD for bullish breakout patterns.
Disclaimer
Content provided by CryptoTraderNews is for informational purposes only, and should not be construed as legal, tax, investment, financial, or other advice. All information is of a general nature. As always, there is risk with any investment. In exchange for using our products and services, you agree not to hold CryptoTraderNews Pro, its affiliates, or any third party service provider liable for any possible claim for damages arising from decisions you make based on information made available to you through our services.
[/wlm_private]
Want to read the rest of the article? Join our pro-membership and receive all of the following:
✅Access to ALL content.
✅Access to the CTN editorial staff.
✅Access to our CTN trading dashboard.
✅Access to our exclusive telegram channel where all our pro-members and editorial staff are in.
✅Ability to request content/research material!
1 comment
[…] Bitcoin […]
Comments are closed.