
EOS started the year 2019 with a strong bullish trend and ended with a bearish trend.
By market cap, it is considered the world’s seventh-largest blockchain, with a value topping $3 billion since February 2019.
[wlm_private “Crypto Trader Pro – Monthly|Crypto Trader Pro – Yearly|Crypto Trader Pro (Lite)”]
The blockchain-based platform facilitates the development of commercial-scale DApps on the EOS.IO program.
2019 saw EOS every other coin, experience a flurry of activities that affected the overall outlook of the coin.
We shall highlight some of these significant events below.
Release of EOSIO™ Explorer by EOSIO Labs™
In May this year, EOSIO labs announced the new version of EOSIO Explorer.
The graphic user interface was aimed at enhancing the developer experience of monitoring and interacting with EOSIO-based applications and systems in development.
As opposed to the earlier interface, which only enabled developers to use a less user-friendly command-line based toolchain, the new Explorer and their browser would allow developers to check blocks in their development nodes efficiently.
EOSIO™ Software Release
EOSIO also announced the release of a new pair of open-source EOSIO tools to create a robust mobile experience on EOSIO. The tools are their solution to providing friendly SDKs (Software Development Kits) for the growing number of mobile app users, which was aimed at enhancing primary mobile apps development on EOSIO, which includes EOSIO SDK for Swift programming language and EOSIO SDK for Java programming language.
Targeting these programming languages, according to EOSIO, was creating an opportunity for Android and iOS to leverage these capabilities.
Support from Crypto.com
In 2019, EOS also gained support from payments platform Crypto.com, which aims at making the buying, selling, sending, paying, tracking of cryptocurrencies much easier for its users. It is also boosting the use of EOS by integrating the cryptocurrency into several of its flagship services.
Crypto Earn Support
EOS also garnered support from Crypto Earn, a tool that enables users to receive interest on their coins and tokens.
MCO Visa Card Support
In addition to support from Crypto.com, they now have access to the MCO Visa Card, which gives consumers the much-needed freedom to spend digital assets anywhere that Visa is accepted. This includes in-store and online shopping, restaurants and hotels, among other consumer outlets, unlocking access to about 50 million possibilities.
EOS Analysis
EOSUSD: Monthly Time Frame
The last quarter of 2018 had a strong bearish trend into the first month of 2019, however, the previous month low of $1.5000 in Q4 2018 established strong support and forceful rejection of price at that zone.
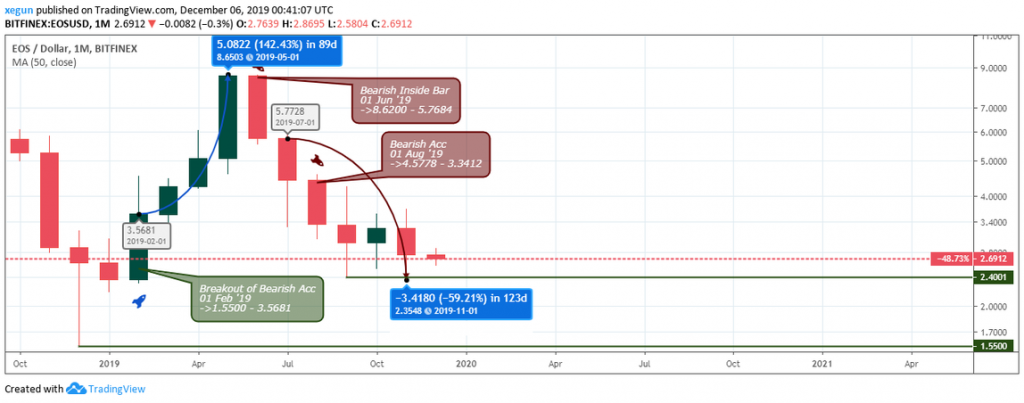
Q1. After the rejection of the price in Q4 2018, Q1 of 2019 had a breakout of bearish accumulation on February 1, where the price range was between $1.5000 and $3.5681. EOSUSD closed at $3.5681 for an increase in price.
Q2. The bullish trend rose 142.43% to $8.6503 on May 1, 2019 from the close of $3.5681 on February 2, 2019. The early part of the 2nd quarter had a continuation of an uptrend until the market hit resistance, with the last month of the 2nd quarter clearly indicating retracement.
Q3. The bearish inside bar of June 1, 2019 between $8.6200 and $5.784 made Q3 start with a strong bearish trend. The bearish accumulation on August 1, between $4.5778 and $3.3412 moved the sentiment of the market to the downside, finding support at a $2.4001 low.
Q4. From the opening of Q3 at $5.7728 to the current price in Q4, the price has moved downward by -59.21% to rest at $2.3548 on November 1, 2019.
EOSUSD: Weekly Time Frame
EOSUSD started 2019 with a recovery of the last bearish market following the December 17, 2018 breakout of bearish accumulation of $1.5500 to $2.87712. It was an early sign that buyers were placing orders.
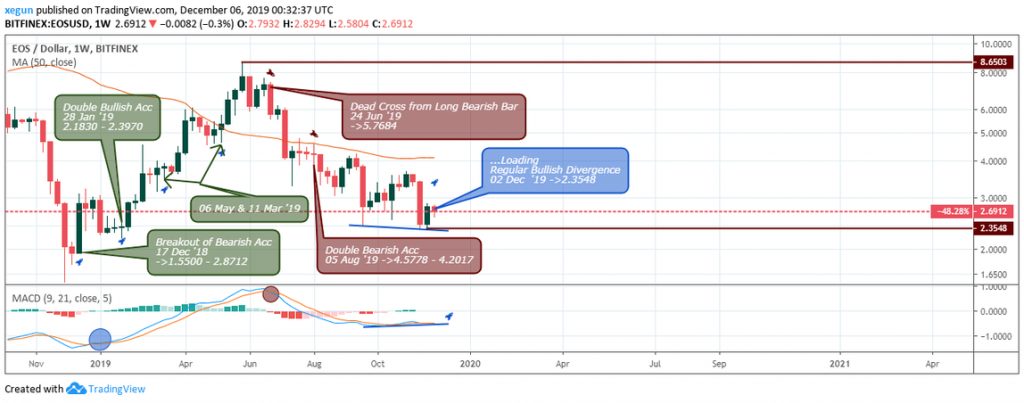
Then January 28, 2019, a double bullish accumulation was made with prices ranging between $2.18330 and $2.3970. Subsequently, on the 6th and 11th of May, a double bullish accumulation pattern revealed itself, a sign that more buyers were in the market.
The bull’s rally met resistance at $8.6503, rejecting EOSUSD price from gaining momentum to the upside. On the June 24, 2019 candle, with a dead cross from the long bearish bar, the $5.7684 price point indicated the bearish momentum to the downside.
Then on August 5, 2019, a double bearish accumulation shows more selling pressure in the EOSUSD market and prices ranged between $4.5778 and $4.2017. Moving to December 2, 2019, the price dropped to $2.3548, which shows a regular bullish divergence. At this point, we wait for the market to give us other confirmation before we go long.
EOSUSD: Daily Time Frame
On December 15, 2018 with a $1.9285 close price, a breakout of bearish accumulation happened, which ran into the December 16th price range of $1.7746 to $1.9479, indicating buyers taking the position.
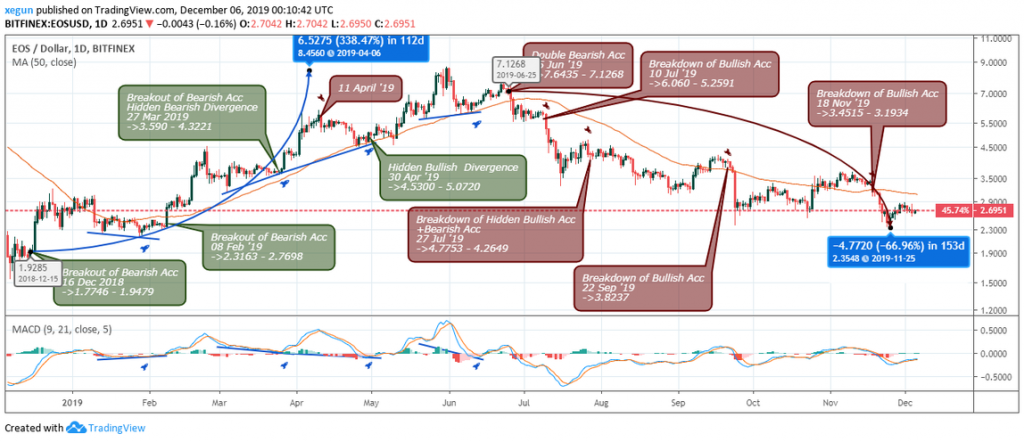
During January, the MACD showed a hidden divergence. The price of EOSUSD was dropping while the oscillator was rising, indicating a possible continuation of the trend. On February 8, 2019, the price range was $2.3163 to $2.7698, with a breakout of bearish accumulation confirming the continuation of an uptrend.
A breakout of bearish accumulation and hidden bearish divergence occurred on March 27, 2019, giving rise to price of $3.590 to $4.3221. Also, on April 30, 2019 with the price range between $4.5300 and $5.0720, a hidden bullish divergence showed more momentum to the upside. The market made a high of 338.47% at $8.4560 on April 6, 2019 from the low of $1.9285 on December 15, 2018.
A close of the candle at $7.1268 on June 25, 2019 leads to double bearish accumulation with prices between $7.435 and $7.1268; a reversal of the trend. This is where the price falls below the 50-MA, with another breakdown of bullish accumulation and price points between $6.060 and $5.2591 on July 10, 2019.
The market has been in a steady downfall with a breakdown of hidden bullish accumulation July 27, 2019 at $4.7753 to $4.26649; September 22, 2019 at $3.8237, and $3.4515 to $3.1934 on November 18, 2019.
The market made a decrease in price by -66.96% to fall to $2.3548 as of November 25, 2019 from the high of $7.1268 on June 25, 2019.
The Bears and Bulls Scenario
Bullish Scenario
The bulls are currently not in control of the market. Now we wait for a definite move of price to ascertain its direction as we prepare for Q1 2020.
Bearish Scenario
The trend has been in favor of the bears, however, for the momentum to continue to the downside, the recent low of $2.3548 must be taken out with a breakdown close.
Disclaimer
Content provided by CryptoTraderNews is for informational purposes only, and should not be construed as legal, tax, investment, financial, or other advice. All information is of a general nature. As always, there is risk with any investment. In exchange for using our products and services, you agree not to hold CryptoTraderNews Pro, its affiliates, or any third party service provider liable for any possible claim for damages arising from decisions you make based on information made available to you through our services.
[/wlm_private]
Want to read the rest of the article? Join our pro-membership and receive all of the following:
✅Access to ALL content.
✅Access to the CTN editorial staff.
✅Access to our CTN trading dashboard.
✅Access to our exclusive telegram channel where all our pro-members and editorial staff are in.
✅Ability to request content/research material!