
Let’s start off with Ethereum’s 90-day price range with a high of $195.94 to a low of $119.78; the 52-week high/low being $361.40/$102.93 according to coinmarketcap.com. As we close out 2019, we are taking a look at the market analysis to see if we can get ahead with some Ethereum price predictions for Q1-2020.
[wlm_private “Crypto Trader Pro – Monthly|Crypto Trader Pro – Yearly|Crypto Trader Pro (Lite)”]
Ether (ETH), the number two cryptocurrency by market capitalization, exited crypto winter with a positive outlook like most cryptocurrencies in the top ten list by market cap. The price, however, resumed a bearish trend at the end of Q2-2019.
Let’s analyze the price dynamics and interesting fundamental trend drivers of the ETHUSD price pair in 2019.
Ethereum Analysis
ETHUSD: Monthly Time Frame
ETHUSD has been in a downward trend since the bearish accumulation pattern on October 1, 2018, with resistance set at $198.7, and a price decline of about 59.07% from the bearish accumulation pattern.
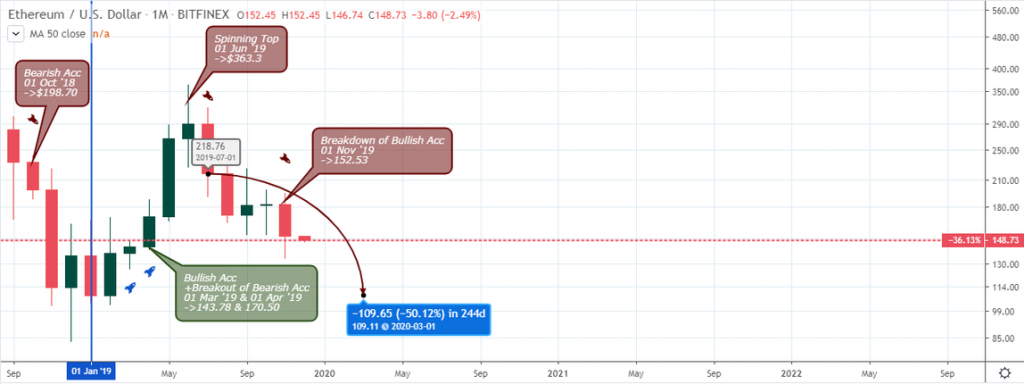
The bulls took over the market by a breakthrough of the $161.20 bearish accumulation resistance which later signaled a bullish accumulation set up on March 1, 2019 at $141.25, showing a further optimistic outlook.
With the formation of the spinning top candlestick on June 1, 2019 at $363.3, indicating that the bulls are beginning to lose control of the market, followed by a breakdown of bullish accumulation on November 1, 2019 at $152.53, it was a confirmation that the bears have taken control of the market.
We anticipate that the bears will continue dominate ETHUSD to around the $109.11 region, into the new year.
ETHUSD: Weekly Time Frame
On the ETHUSD weekly time frame, the bulls took over the market with the formation of a breakout of bearish accumulation on December 17, 2018, with long entry at $133.76, setting support at $83. The early bearish price slump was as a result of a negative interpretation of the DevCon4 conference on October 30 2018, which led to a price decline of about -2.32%
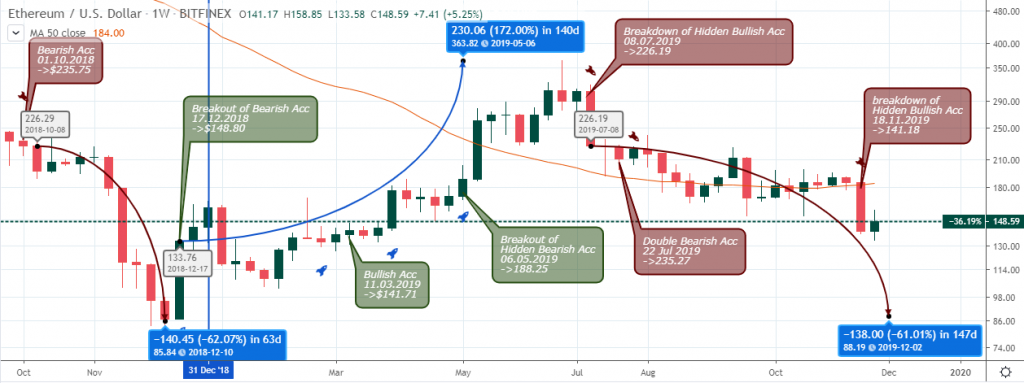
The Classic Vision Hard Fork of January 11, 2019 and Ethereum Constantinople of January 16, 2019 was an early catalyst to an exit from the 2018 crypto winter for a price increase of about 10.97%.
With the formation of bullish accumulation on March 11, 2019, it set up support at $141.71. The bulls broke through the resistance, tested the support, and ultimately assumed control with a breakout of hidden bearish accumulation on May 6, 2019.
Breaking above the MA-50, the ETH price rallied up to $363.82 on June 24, 2019, which is about 172.00% at the 140 day mark. A breakdown of hidden bullish accumulation on July 8, 2019, at $226.19, reveals the end of the bullish rally.
On July 22, 2019, at $235.27, the price chart clearly shows that the bears are back in control, later breaking the MA-50 supports for the first time on August 26, 2019.
We project the bears will dominate the ETHUSD price pair through the end of the year and into Q1-2020.
ETHUSD: Daily Time Frame
Lastly, on the daily time frame, a regular bullish divergence signals the presence of bulls on December 17, 2018 at $97.25, as the uptrend rallies to $334.20 on May 5, 2019; approximately 235.02% in 152 days.
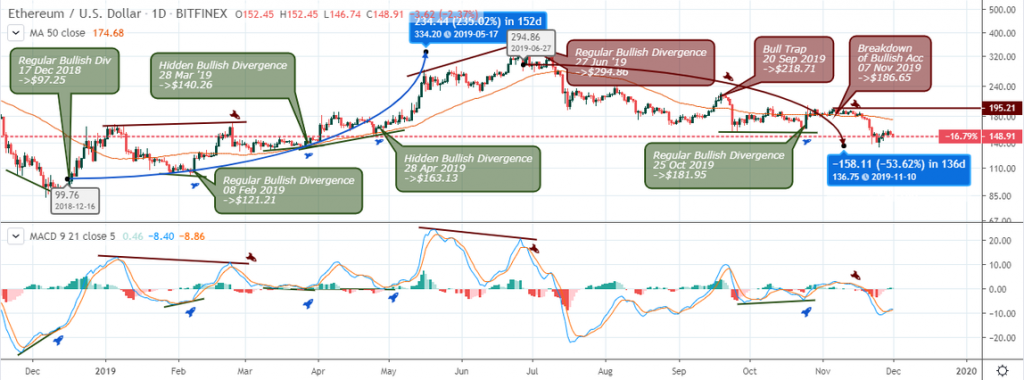
A regular bearish divergence on June 27, 2019 at $294.8 indicates the presence of bears in the market. The market then retraced and broke through MA-50, which served as resistance. But there was a bull-trap on September 20, 2019, which signaled that bears are back in the market, again breaking MA-50 to push towards the $143.91 support, countered by a regular bullish divergence pattern.
On October 25, 2019 at $181.95, the chart indicated the presence of bulls but the rally to MA-50 was unable to break through. Then on November 17, 2019 at $186.65, a breakdown of a bullish accumulation stressed that the bears took control of the market, breaking through MA-50 to set support at $143.91.
We anticipate the move to reach $136.75, which is roughly 53.62%.
The Bears and Bulls Scenario
Bullish Scenario
Generally, the price is around $143.91 the support zone. If the bears can’t push through, we are likely going to see a price recoil to the upside.
Bearish Scenario
November’s breakdown of bullish accumulation reinforced the probability of the price moving down toward the December 1, 2018 low at $80.60. Let’s not forget the live launch of the Ethereum Istanbul hardfork that sets a strong bearish undertone towards ETHUSD.
Disclaimer
Content provided by CryptoTraderNews is for informational purposes only, and should not be construed as legal, tax, investment, financial, or other advice. All information is of a general nature. As always, there is risk with any investment. In exchange for using our products and services, you agree not to hold CryptoTraderNews Pro, its affiliates, or any third party service provider liable for any possible claim for damages arising from decisions you make based on information made available to you through our services.
[/wlm_private]
Want to read the rest of the article? Join our pro-membership and receive all of the following:
✅Access to ALL content.
✅Access to the CTN editorial staff.
✅Access to our CTN trading dashboard.
✅Access to our exclusive telegram channel where all our pro-members and editorial staff are in.
✅Ability to request content/research material!
1 comment
[…] Ethereum […]
Comments are closed.