INTRODUCTION
Panic hits the cryptocurrency market as BTCUSD threatens another bearish impulse wave, following the uncertainties with Facebook’s Libra and the Telegram Open Network (TON).
Many armchair and legitimate crypto and bitcoin analysts believe that Bitcoin’s price could drop to the $5500 level before the current price correction comes to a close.
[wlm_private “Crypto Trader Pro – Monthly|Crypto Trader Pro – Yearly|Crypto Trader Pro (Lite)”]
Are they right?
In this post, we look at the likely scenarios for a prolonged price decline and bullish price recoil.
Quick Recap on the Price Rally
The Bitcoin price surged following a breakout of bearish accumulation and MA-9 on April 01, after trading below the Moving Average for thirteen months. We consider the pair to be in a bullish trend since the price trades above the MA-9.
Technical Analysis
Let’s continue by carrying out a top-down analysis of the BTCUSD starting from the monthly time frame and down to the 4-hour chart.
BTCUSD: Monthly
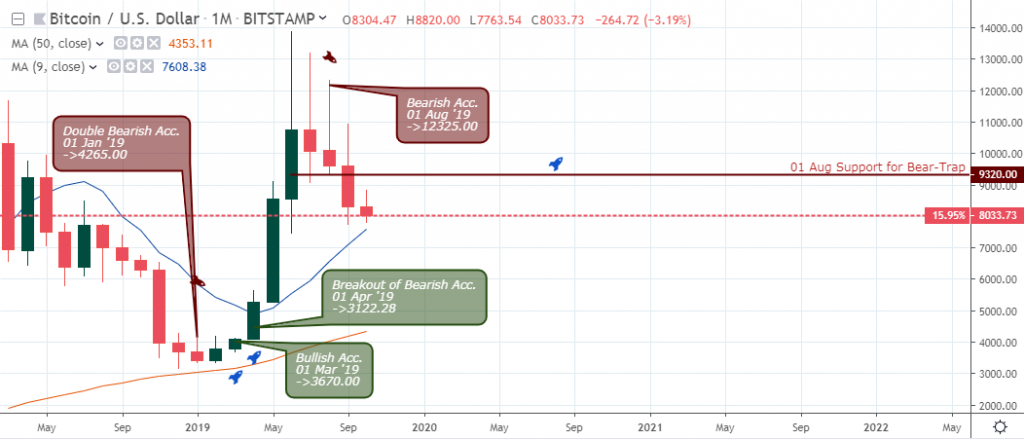
A bearish accumulation pattern triggered the current price correction after the current high of $13880.00 at the closing price of August 01 ’19.
The likelihood that Bitcoin reaches the earlier projected price of $5,500 is unlikely this month, as the MA-9 current serves as a support, a significant threshold preventing further price decline.
A scenario for a price plunge to the $5,500 region will be if the current month of October closes bearish within the high-low range of September. In that case, signaling another bearish accumulation pattern, we could then expect the price to plummet or look forward to a breakout towards the up position.
If October close bullish above the $9,320 resistance, signaling a bear-trap opposition, we should then lookout for early recovery of the Bitcoin price into a bullish trend.
BTCUSD: Weekly
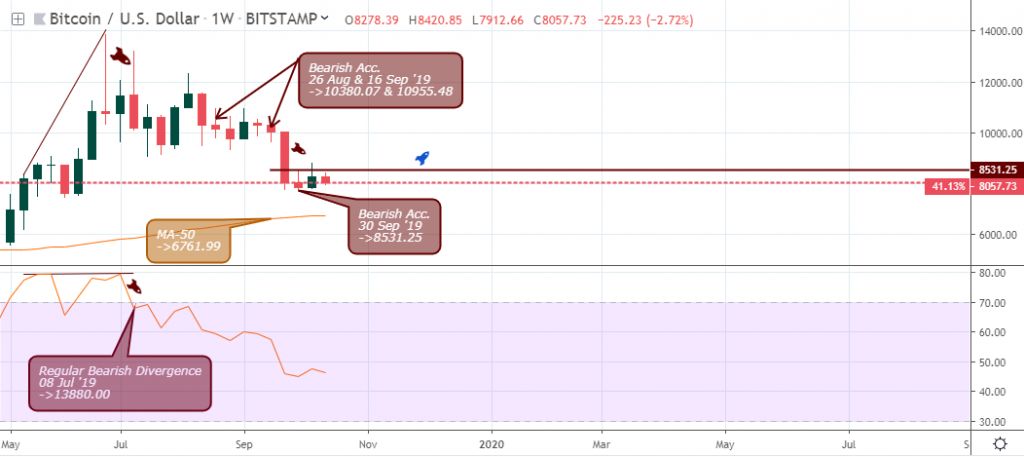
The weekly chart above tells a more detailed story on the price breakdown, compared to the monthly time frame.
It all started from a regular bearish divergence pattern on July 08, while at the same time exiting the overbought area.
The bearish accumulation patterns on August 26 and September 16 set up sound resistance levels at $10,380.07 and $10,955.48.
For the BTC price to resume the bullish upbeat, the $8,531.25 support established by the bearish accumulation pattern on September 30 will have to be breached by a price close above the level by a weekly bar.
A price close above the recent significant resistance level will be a strong confirmation to a harmonic pattern and eventually sending the Bitcoin price above this year’s local high.
BTCUSD: Daily
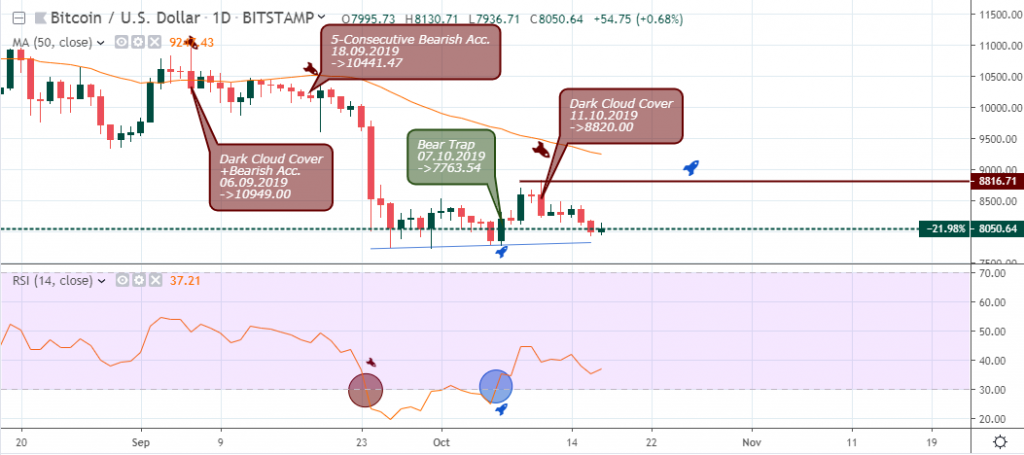
Viewing from the daily time frame, we get to see the current bearish trend build from an increase in selling pressure on September 06 and 18.
Recently on October 15, an increase in selling power forced the Bitcoin price below hidden bullish accumulation after a dark cloud cover on October 11. Although the BTCUSD may have exited the oversold area on October 07, and forming higher lows, the new sell power may be strong enough to break below the bullish trend (Blue).
BTCUSD: 4-hour
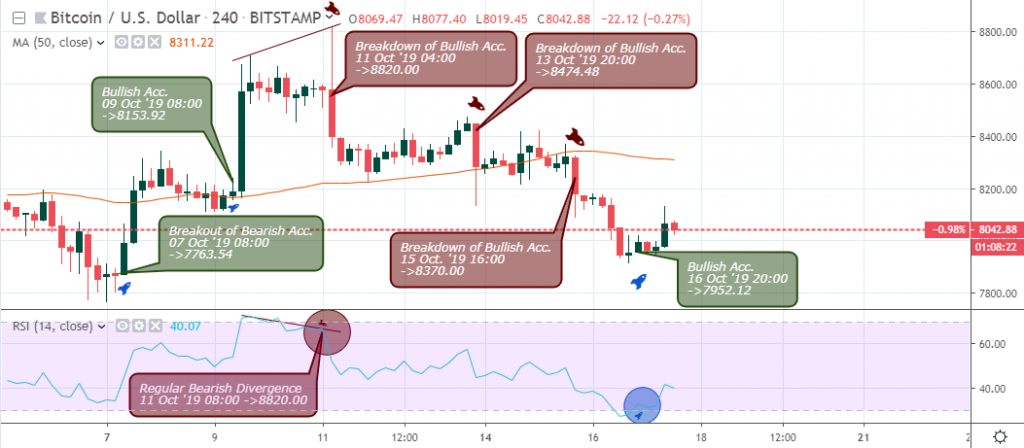
Way down at the 4-hour time frame, attempts by the bulls continue to indicate selling pressure beginning from October 11, 13, and 15. The bullish accumulation pattern on October 16 suggests consecutive bullish closing bars. However, the move might be negated if the MA-50 is not breached.
Conclusion and Projection
The last leg of bearish harmonic patterns is best confirmed by candlestick patterns, such as a rejection of bearish accumulation, as shown in the chart below.
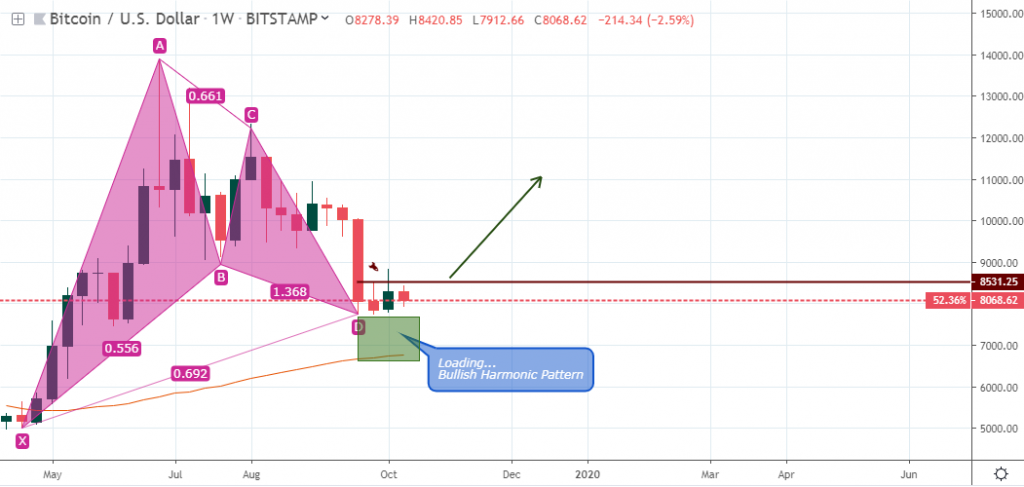
If the price decline ends at this stage, we may be on to something similar to a Gartley harmonic pattern; otherwise, a further reduction of the price may suggest a Bat harmonic pattern.
Disclaimer
Content provided by CryptoTraderNews is for informational purposes only, and should not be construed as legal, tax, investment, financial, or other advice. All information is of a general nature. As always, there is risk with any investment. In exchange for using our products and services, you agree not to hold CryptoTraderNews Pro, its affiliates, or any third party service provider liable for any possible claim for damages arising from decisions you make based on information made available to you through our services.
[/wlm_private]
Want to read the rest of the article? Join our pro-membership and receive all of the following:
✅Access to ALL content.
✅Access to the CTN editorial staff.
✅Access to our CTN trading dashboard.
✅Access to our exclusive telegram channel where all our pro-members and editorial staff are in.
✅Ability to request content/research material!

2 comments
[…] Bitcoin […]
[…] Bitcoin […]
Comments are closed.