
Ethereum’s price is down by 9.73% in the past week and technical indicators are showing an increasing bearish momentum in the Ethereum charts. The market is trending below the SMA 200, SMA 50 and SMA 20 curves and the ETH/USD bears have taken back full control of the market following a bullish week.
[wlm_private “Crypto Trader Pro – Monthly|Crypto Trader Pro – Yearly|Crypto Trader Pro (Lite)”]
There is decreased market volatility and looking at the hourly ETH/USD chart, we can see that the price found support at $172 and jumped up to $177.75 and the coin is currently trading at $172. The price swung back and forth before it corrected at $172.
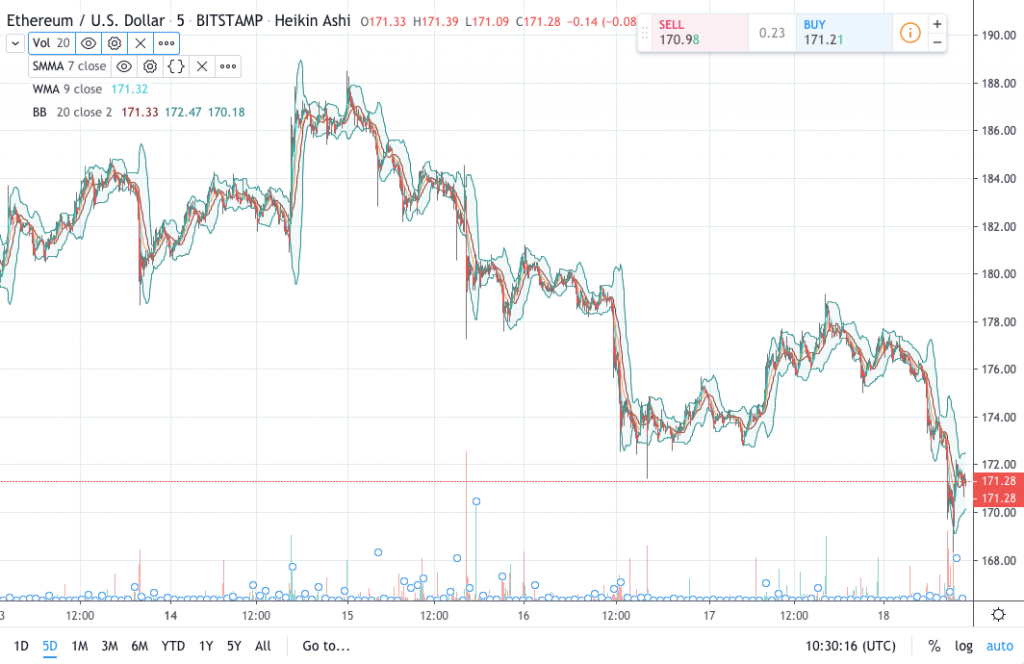
Bulls have to overcome resistance at $178 to continue upward momentum. The Bollinger Band indicates increasing bearish momentum, while the Elliott Oscillator has had five straight bearish sessions of growing intensity. Ethereum price extended its decline and broke the $175 support area against the USD and the Bitcoin price is also down more than 3% as it broke the $8,000 support area.
The highlighted bearish trend is intact with resistance near $175 and the pair remains in a bearish zone and it could face resistance near $175 and $178 in the near term. Ethereum’s price is under tremendous selling pressure versus the USD, similar to Bitcoin. ETH price remains at a risk of more losses below the $170 level.
There have been bearish signs since the price dropped below the $185 resistance area against the USD. ETH price remained in a bearish zone and even broke the $180 support within a few days. Moreover, there was a close below $180 and the 100 hourly SMA. It opened the doors for more downsides and the price broke the key $175 support area, traded close to the $170 level. The price is consolidating losses above the $172 level and an immediate resistance is near the $175 level.
If there is an upside break above $175, the price could test the $177 resistance area. Additionally, the 100 hourly SMA is also positioned near the $180 level to act as a strong resistance if the price corrects higher in the near term.
On the downside, the $172 and $170 levels are where the immediate supports lay. If there is a downside break below the $170 support, the price could continue to decline with its next stop around $160, that is if Ethereum continues down the slope this weekend. Our experience helps us hypothesize that there is a greater chance for more downside movement this weekend.
Disclaimer
Content provided by CryptoTraderNews is for informational purposes only, and should not be construed as legal, tax, investment, financial, or other advice. All information is of a general nature. As always, there is risk with any investment. In exchange for using our products and services, you agree not to hold CryptoTraderNews Pro, its affiliates, or any third party service provider liable for any possible claim for damages arising from decisions you make based on information made available to you through our services.
[/wlm_private]
Want to read the rest of the article? Join our pro-membership and receive all of the following:
✅Access to ALL content.
✅Access to the CTN editorial staff.
✅Access to our CTN trading dashboard.
✅Access to our exclusive telegram channel where all our pro-members and editorial staff are in.
✅Ability to request content/research material!