To have a good idea of where we’re headed, it’s always a good idea to get insight into where we’ve been, how we overcame obstacles and how to move forward with hard-learned lessons emblazoned in our minds so we don’t repeat the bad cycles of the past. Such is life and that of the stock market.
[wlm_private “Crypto Trader Pro – Monthly|Crypto Trader Pro – Yearly|Crypto Trader Pro (Lite)”]
Ray Dalio, the founder of Bridge Water and Associates in an interview with Patrick Bet-David of Valuetainment, predicts the next big market crash.
Mr. Dalio, who happens to be the 25th richest man in America, a philanthropist, and New York Times best-selling author, analyzed the likelihood of a massive market crash.
In this article, we enter our time machine and carry out an in-depth overview of past stock market crashes, beginning with a little history, analyzing the significant technical catalyst that led to the crashes, how the markets recovered, and what to expect in the future.
Wall Street Crash of 1929 and the Great Depression
The Wall Street Crash of 1929, commonly referred to as Black Tuesday, occurred on October 29, 1929; one of the major events that led to a decade-long Great Depression through the 1930’s.
Price of shares on the New York Stock Exchange collapsed, accelerating the economic collapse and a pandemic of lost jobs and homes. It had a rippling effect all around the world.
To get to that point, the U.S. stock market recorded rapid expansion during the 1920’s, getting to its top in August 1929 after a lot of speculation. Stocks were in significant excess to their real value. Then the bubble popped. Production declined, unemployment rose and on top of this, the agriculture sector was struggling. Wages were low and there was a proliferation of debt, as well as an excess of massive bank loans that couldn’t be liquidated.
There wasn’t immediate panic though. Stock prices were slowly dropping in September, but by October 21st, people were demanding their money, banks were closing their doors because they couldn’t keep up with the demand, and by October 29th, stock prices fully collapsed. Of note, a record of 16,410,030 shares was traded on NYSE in one day.
While financial giants such as the Rockefeller family and William C. Durant were buying large quantities of stocks to demonstrate their confidence in the market, really a futile attempt to stabilize the market, the price was still on rapid decline.
Before the end of the day, the market had lost $14 billion, making the crash the biggest and most significant crash in financial market history. The Great Depression was upon us.
Technical Analysis
DJI: Weekly Time Frame
The Wall Street crash of 1929 lasted about four years. The bearish trend started with a buildup of regular bearish divergence on September 16, 1929, showing exhaustion on the part of the bulls.
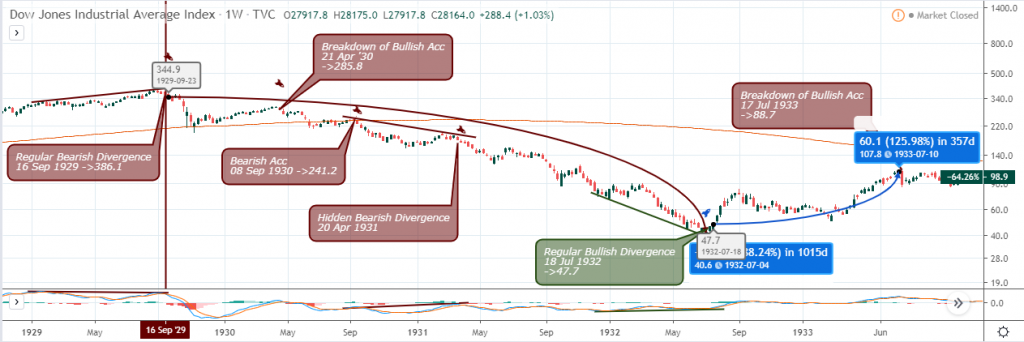
A bearish closing price around $344.9 on September 23, 1929, confirmed the first entry to short the Dow Jones Industrial (DJI) for a total price decline of about 88.24%.
Subsequent opportunities to scale into a bear market came up in the form of a breakdown of bullish accumulation on April 21, 1930, and a hidden bearish divergence pattern on April 20, 1931, reinforced the bearish trend, increasing the confidence to short the DJI.
From the hidden bearish divergence chart pattern, the price slumped by approximately 76% with low-risk exposure, considering that the price traded below the 50 and 200-weekly Moving Average.
An opposite regular bearish divergence flagged on July 18, 1932, accurately predicted the bottoming of the crash as the DJI soared back up towards the 200-MA (weekly).
Recession of 1937-1938
The recession, which lasted from May 1937 until June 1938, is considered America’s third-worst downturn of the 20th century.
During the recession, which was less severe than the recessions of 1920 and 1929, real GDP dropped ten percent while unemployment, which had declined considerably after 1933, hit 20%.
The recession is believed to have been possibly triggered by a contraction in the money supply caused by the Federal Reserve and Treasury Department contractionary fiscal policies. Federal policymakers had in 1936 doubled reserve requirement ratios to soak up ‘banks’ excess reserves to prevent an “injurious credit expansion.”
Technical Analysis
DJI: Weekly Time Frame
The chart below shows the DJI enclosed in an expanding channel built by opposing bearish and bullish divergence setup on April 20, 1936, and May 11, 1936, and still stayed in the bullish trend for another 26.46% before finally giving in to another regular bearish divergence on March 29, 1937.
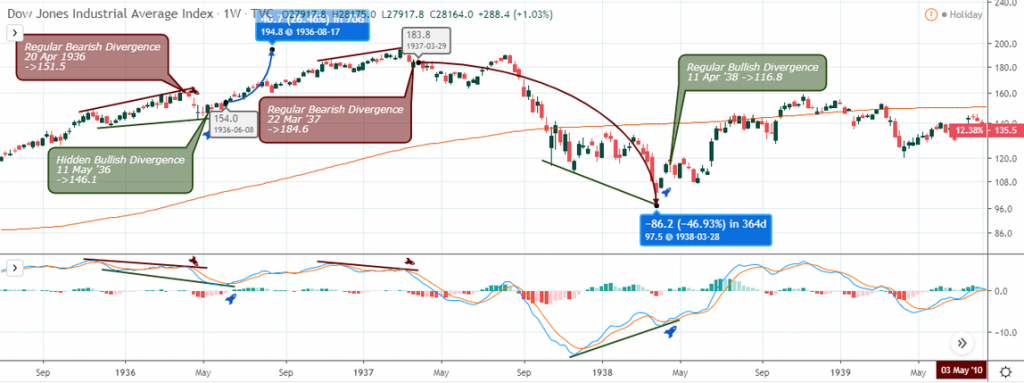
An increase in selling pressure after the March 22 regular bearish divergence sent the price crashing south by roughly 46.93%.
The Recession ended as the DJI signaled an opposite regular bullish divergence on April 11, 1938, with a price recoil back towards the MA-200.
Kennedy Slide of 1962
The slide of 1962, also known as Kennedy’s slide, occurred between January to October 1962 as the value of stock went down by 21.7%.
During the 1950’s, the market had experienced some drop of more than 10%. However, by 1962, with the political uncertainty surrounding the country over its sharp disagreement with Russia over Vietnam and Cuba, and the aftermath of President Kennedy’s criticism of steelworkers for unilateral price increases, they was a bear run that led to a drop of more than 20%.
Technical Analysis
DJI: Weekly Time Frame
The Kennedy Slide of 1962, like the earlier analyzed chart, also started with a regular bearish divergence pattern after an upward price surge where the pair bounced of the MA-200 on November 14, 1960.
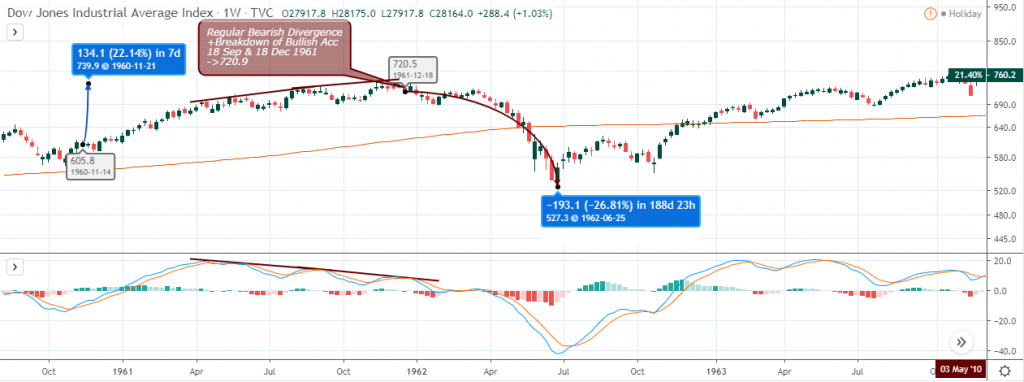
After attaining an increase of about 22.14%, December 18, 1961, regular bearish divergence, a second and decisive trend reversal pattern after September 18, 1961, and divergence led to a price slump of about 26.81%.
Stock Market Crash 1973-1974
The crash, which began in 1973 to October 1974, erased almost 43% of the S&P 500’s value. U.S. real GDP growth fell from 7.2% to -2.1% from 1972 to 1974, and inflation swept from 3.4% to 12.3%.
OPEC’s oil embargo in 1973, which caused oil prices to quadruple, was one major cause of this downtrend in the economy. Uncertainty from the Watergate scandal also contributed to the crash as criminals connected to Nixon’s re-election campaign were arrested in June 1972 for breaking into the headquarters of the Democratic National Committee’s.
Nixon resigned a few months to the end of the bear run.
Technical Analysis
DJI: Weekly Time Frame
Upon hitting the 200-weekly Moving Average, the Dow signaled a regular bullish divergence pattern on August 27, 1973, an increase in demand that could not stand the test of time.
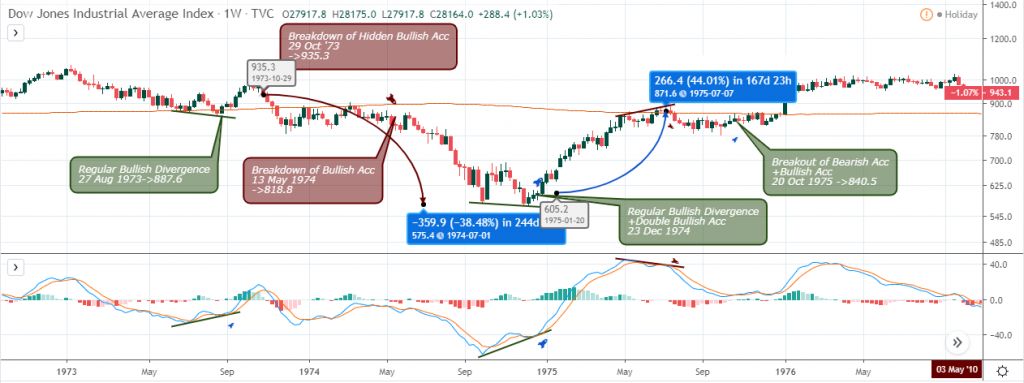
A breakdown of hidden bullish accumulation support on October 29, 1973, resulted in a price plummet below the MA-200.
After hovering under the 200-weekly MA resistance for about twenty weeks, the DJI bullish accumulation support failed to an increase in selling pressure on May 13, 1974.
The bears completed a 38.48% price drop before the bulls signal a regular bullish divergence on December 23, 1974, confirming an end to the market crash.
Black Monday 1987
The black Monday crash occurred on October 19, 1987 and saw stock markets around the world suffer one of its worst days in history.
The crash, which began in Asia following a long-running rally, became more intense London and culminated with the Dow Jones Industrial Average recording its worst day in history in percentage terms as it went down a 22.6% for the day.
Possible reasons behind the crash vary from a drop in oil prices, a slowdown in the U.S. economy, and growing tensions between the U.S. and Iran.
By the month’s end, stock markets had dropped in Hong Kong by 45.5%, in Australia by 41.8%, and in the United Kingdom by 26.45%. Spain recorded a 31% drop, while the United States and Canada dropped 22.68% and 22.5%, respectively.
Technical Analysis
DJI: Weekly Time Frame
The 1987 Black Monday, like other market crashes, came after a bullish outlook on the DJI.
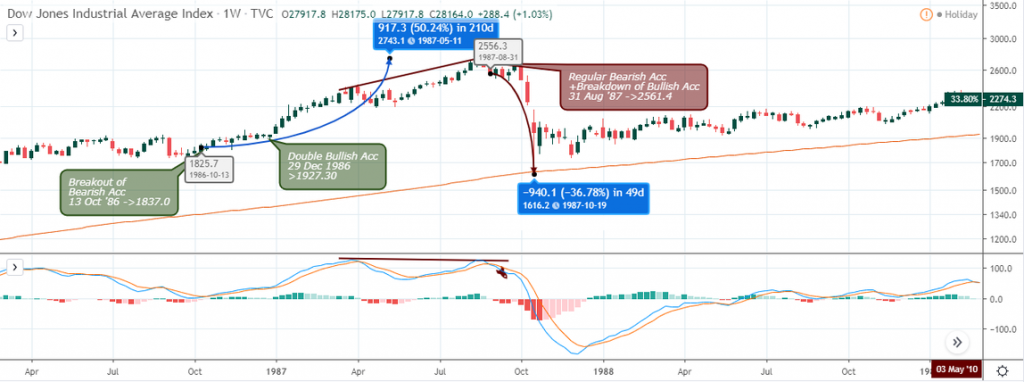
From a breakout of bearish accumulation resistance on October 13, 1986, the Dow rallied by an estimated 50.24% from the breakout level.
While the price attained new highs, the MACD oscillator failed to do the same, consequently flagging a regular bearish divergence pattern in combination with a breach of bullish accumulation support on August 31, 1987, and sending the price into a downward spiral.
The price slumped by 36.78% from the divergence pattern and was halted after hitting the 200-period Moving Average (Weekly TF).
Early 1990’s Recession
The early 1990’s recession is the period of economic uncertainty that affected much of the Western world in the early 1990’s.
The recession had so many after-effects like the electoral defeat of President George H. W. Bush in the U.S, the resignation of Canadian Prime Minister Brian Mulroney, reduction of active companies by 15%, civil disturbances in the United Kingdom, unemployment up to nearly 20% in Finland, and the rise of discount stores in the U.S.
The recession was primarily triggered by such factors as
- the end of the Cold War and the subsequent decrease in defense spending,
- the loss of consumer and business confidence as a result of the 1990 oil price shock,
- the restrictive monetary policy enacted by central banks mostly in response to inflation concerns,
- the savings and loan crisis
- And a drop in office construction rising from overbuilding throughout the 1980’s.
However, by 1994, the slump had been arrested, and global GDP growth returned to normal.
Technical Analysis
DJI: Weekly Time Frame
In the early 1990’s recession, like most of the market, crashes we’ve looked at started with a regular bearish divergence in combination with a collapse of bullish accumulation on July 23, 1990.
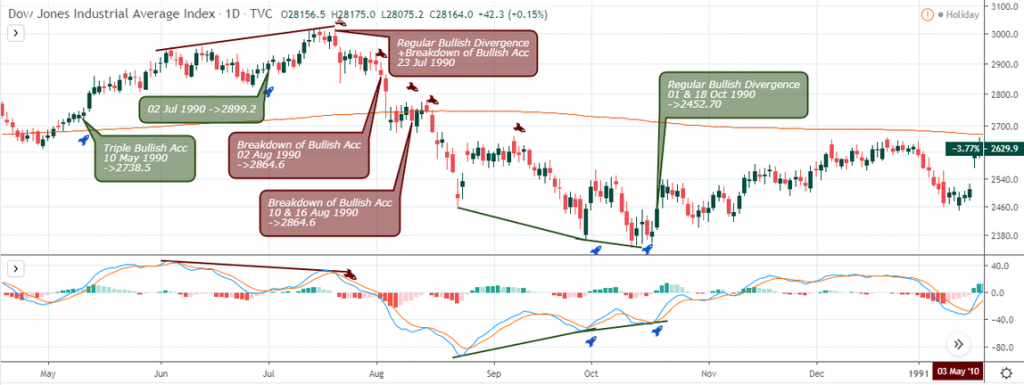
An increase in selling pressure from the divergence setup forced the price south bound and way below the 200 daily Moving Average on August 10 and 16, 1990.
This market crash lasts for about three months before a series of regular bullish divergence pattern on October 1, and 18 1990 confirmed the bottom of the bearish trend.
1997 Asian Financial Crisis
Technical Analysis
Nikkei: Weekly Time Frame
The Nikkei 225 index launched a bullish campaign on July 3, 1995, after a regular bullish divergence pattern for a 36.98% price increase.
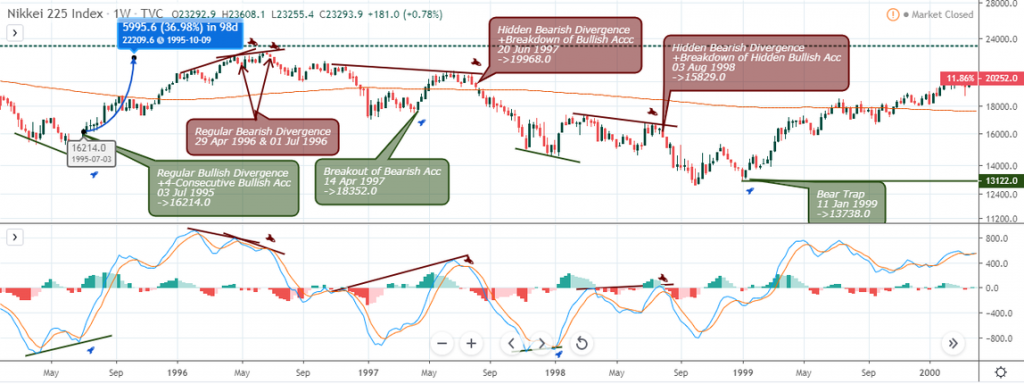
A series of opposing regular bearish divergence patterns on April 29, 1996, and July 3, 1996 signaled the start and short-selling into the Asian Financial Crisis.
Going forward, hidden bearish divergence patterns on June 20, 1997, and August 3, 1998, confirmed opportunities to scale into an existing bearish trend.
Dot-Com Bubble March 10, 2000
The crash known today as the Dot-Com Bubble Burst was as a result of the frenzy of the Internet in the late 1990’s.
The commercialization of the Internet excited and inspired many business ideas and hopes for the future of online commerce. Internet-based companies (‘dotcoms’) were launched in numbers daily, with most investors assuming that every company that operates online is going to one day become very profitable.
The predominant mentality was that as long as a company had the ‘.com.’ suffix after its name, it was worth investing in. Venture capitalists recklessly invested in all kinds of companies, entirely failing to consider traditional fundamentals.
Fueled by overconfidence in the market, cheap money, speculation, and cheap capital, a bubble formed. Even successful businesses were extremely overvalued. However, it didn’t take long for their bubble to burst.
On March 10, 2000, with the NASDAQ index peaking at $5,048.62, a few big high-tech companies such as Cisco and Dell, placed substantial sell orders on their stocks, triggering panic selling among investors. As a result, the stock market lost 10% of its value, investment capital began to melt away, and many dotcom companies went out of business in the next few weeks.
Within a few months, even internet companies that had hit market capitalization in millions of dollars became practically of no value. By 2002, the Dotcom crash had cost investors $5 trillion.
Technical Analysis
DJI: Weekly Time Frame
Another famous market crash is the Dot-com Bubble that started after a 44.10% price rally.
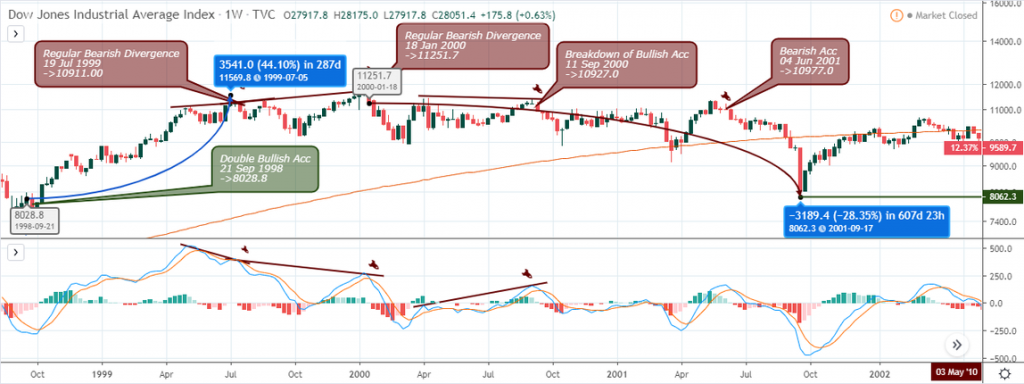
The Dow continued to establish regular bearish divergence patterns beginning from July 19, 1999, and set up two more bullish trend reversal patterns on January 18, 2000, and September 11, 2000.
After trading within a range for about ninety-five weeks, the Dow signaled a bearish accumulation pattern that sent the price crashing below the 200-weekly Moving Average.
The price bottomed at $8062.3 on September 17, 2001, and sprang back towards the MA-200, after a breakout of bullish inside-bar candlestick pattern.
Economic Effects Arising From the September 11 Attack
The economic impact of the September 11 attacks describes the initial shocks causing global stock markets to drop sharply. The attack resulted in approximately $40 billion in insurance losses, making it one of the largest insured events ever.
After the first attack on that day, when the first plane crashed into the World Trade Center’s North Tower, the opening of the New York Stock Exchange (NYSE) was delayed.
By the time the second plane crashed into the South Tower, trading for the day was cancelled outright. Before long, NASDAQ had also canceled trading while The New York Stock Exchange, as well most banks and financial institutions on Wall Street and in several cities across the country.
Around the world, the attack also had similar effects in the global market with The London Stock Exchange and several other stock exchanges around the world closing down and evacuated in fear of follow-up terrorist attacks.
Following the attack, the Federal Reserve moved into action to maintain a stable economy and offset potential disruptions arising in the financial system.
As a result of the mayhem, the price of gold spiked upwards, with an ounce trading at $287 as against $215.50 in London trading. Price oil also spiked upwards, as did the price of gas in the United States. The spike though lasted only about a week
Currency trading continued, with the U.S. Dollar slumping clearly against the British Pound, Euro, and Japanese Yen.
The following day, European stock markets fell sharply, with drops of 4.6% in Spain, 8.5% in Germany, and 5.7% on the London Stock Exchange. Stocks in the Latin American markets also plunged, with a 9.2% drop in Brazil, a 5.2% drop in Argentina, and a 5.6% decline in Mexico before trading was halted.
The attack also had a significant impact on international and domestic markets, as stocks of companies in some sectors were hit particularly hard. Travel and entertainment stocks fell, while communications, pharmaceutical, and military/defense stocks rose. Online travel agencies particularly suffered, as they cater to leisure travel.
Chinese Stock Bubble of 2007
The Chinese stock bubble of 2007 was the global stock market plunge of February 27 and November 2007, which cleaned out hundreds of billions of market value.
The crash was triggered by volatility caused by rumors that governmental Chinese economic authorities were set to raise interest rates. The report, which postulated that the Chinese government in an attempt to curb inflation were planning to crack down on speculative trading with borrowed money, resulted in the SSE Composite Index of the Shanghai Stock Exchange tumbling 9% to record the largest drop in 10 years.
Soon after this drop in Asian markets, the effect was quickly noticeable in markets throughout the globe as the world reacted to the 9% meltdown in the Chinese stock market. The Chinese Correction caused drops and significant unease in nearly all financial markets around the world.
Soon after the drop in China, in the U.S., the Dow Jones Industrial Average dropped 3.29% amid fears for growth prospects. This drop was at the time the biggest one-day slide since the September 11, 2001, terrorist attacks.
The S&P 500 saw a larger 3.45% slide. Sell orders were made so fast that an additional analysis computer had to be used, causing an instantaneous 200 point drop at one point in the Dow Industrial.
Financial Crisis of 2007-08
Considered to be the worst economic crash since the Great Depression, the 2008 global financial crises caused by Wall Street banks’ high-risk trading practices nearly resulted in a fall of the U.S. economy.
The crises were as a result of deregulation in the financial sector, which enabled banks to be involved in hedge fund trading with derivatives.
Banks then asked more mortgages and devised interest-only loans that subprime borrowers were able to afford to sustain the profitable sale of these derivatives. As the interest rates on these new mortgages reset, the Federal Reserve upped the fed funds rates.
Supply outpaced demand and housing prices began to decrease, which made things difficult for homeowners who couldn’t meet their mortgage loan obligations, but also couldn’t sell their house. The derivatives plummeted in value, and banks stopped lending to each other.
Lehman Brothers filed for bankruptcy on 15th September 2008. Bailouts paid by national governments saved HBOS, Merrill Lynch, Royal Bank of Scotland, AIG, Bradford & Bingley, Fortis, Hypo Real Estate, and Alliance & Leicester, which were all expected to follow. Despite this, stock markets across the globe were falling.
What followed was the bursting of the U.S. housing bubble, and Lehman Brothers’ collapse nearly crushed the world’s financial system and resulted in a damaged house market, business crashes, and a wounded global economy.
Technical Analysis
DJI: Weekly Time Frame
The financial crisis of 2007-08 was a popular one among market crashes, and similar to much other crash was signaled by the technical bearish divergence pattern on October 15, 2007, as illustrated below.
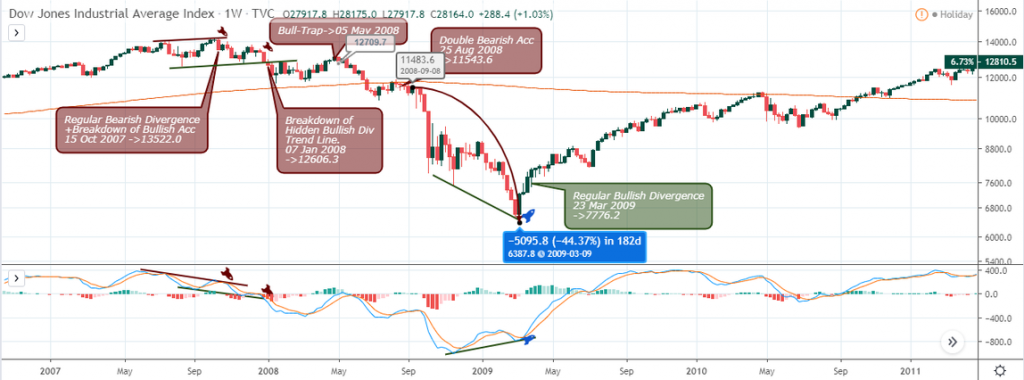
An opposing hidden bullish divergence on January 1, 2008, gave in to increase selling power as the price plummeted below the 200-weekly Moving Average on August 25, 2008.
The bears completed a 44.37% price slump after the double bearish accumulation pattern signaled under the MA-200 on August 25.
An opposite regular bullish divergence again confirmed the bottom of the bearish trend, as the bulls assumed control of the price trend.
European Sovereign Debt Crisis April 27, 2010
Notice the formation of a regular bearish divergence on April 27, 2010, confirming the top of the bullish trend and the beginning of the European Sovereign debt crash.
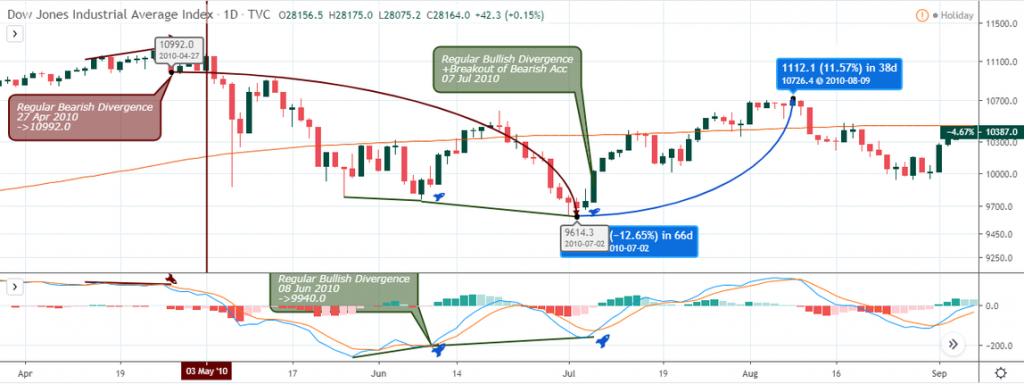
The DOW price slumped by about 12.65% and bottomed after a regular bullish divergence on July 02, 2010. The price surged higher above the MA-200 by roughly 11.57%.
2010 Flash Crash May 6, 2010
The crash, which occurred on the 6th of May 2010, is considered one of the biggest crashes in history. The U.S. stock market on that day lost billions of dollars of the share prices of big US companies in a crash that lasted approximately 36 minutes. Though the decrease occurred at a speed never seen before, it did not have much impact on the American economy.
The market opened that day with general market concerns related to UK general election and the Greek debt crisis. These concerns led to the beginning of the flash crash at 2:30pm with Dow Jones declining by more than 300 points, and the S&P 500 and NASDAQ composite also affected.
Dow Jones dropped by a further 600 points in the next five minutes, reaching a loss of nearly 1000 points for the day. However, the market had regained much of the decrease, and things were looking better by the time it clocked 3:07pm, with the market closing at 3% lower than it opened.
There were suggestions that the crash was triggered by ‘fat-fingered’ trading (a keyboard error in technical trading) or an illegal cyber attack. However, a joint report by the Commodity Futures Trading Commission (CFTC) and the U.S. Securities and Exchange Commission (SEC) stated that the extreme price movement could have been caused by the combination of prevailing market conditions and the large automated sell order.
Stock Markets Fall August 1, 2011
The weekly chart below illustrates the buildup in the stock markets falls on August 1, 2011. A series of four bearish accumulation patterns and a regular bearish divergence that got triggered on May 23, 2011, set the price rolling downhill.
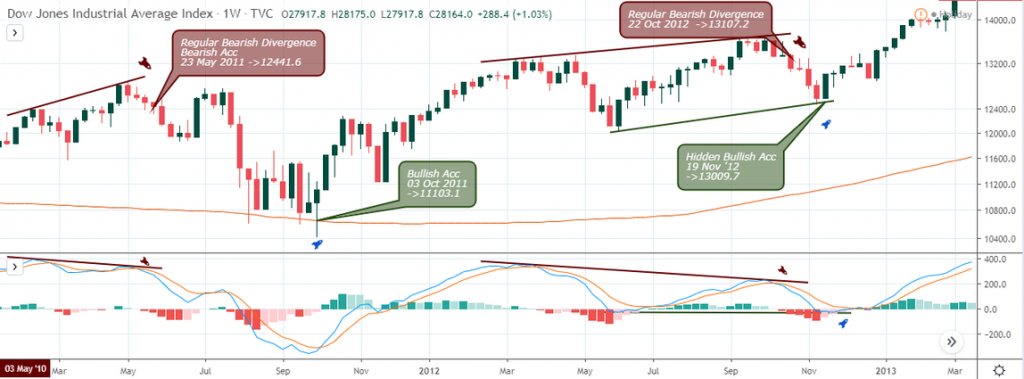
It is one of those market crashes where the Dow price did not plunge below the MA-200, but instead used it as a springboard, resuming the bullish trend.
Chinese Stock Market Crash June 12, 2015
The Chinese market crash, which occurred between July 2015 and June 2016, saw the market lose over $3 trillion worth of mainland shares in just three weeks.
China’s Stock Market burst on June 12, 2015 after a few years of being seen in an increasingly favorable light.
Efforts by the Chinese Government to stabilize the market were not enough to arrest the situation as additional drops occurred on 4th and 7th of January, and the 14th of June 2016. By July 2015, chaotic panic selling had wiped out more than $3 trillion off the value of mainland shares as fear of complete market seizure, and systemic financial risks grew across the country.
The crash is believed to have been caused by a weakening outlook for Chinese growth and the surprise devaluation of the Chinese Yuan on the 11th of August.
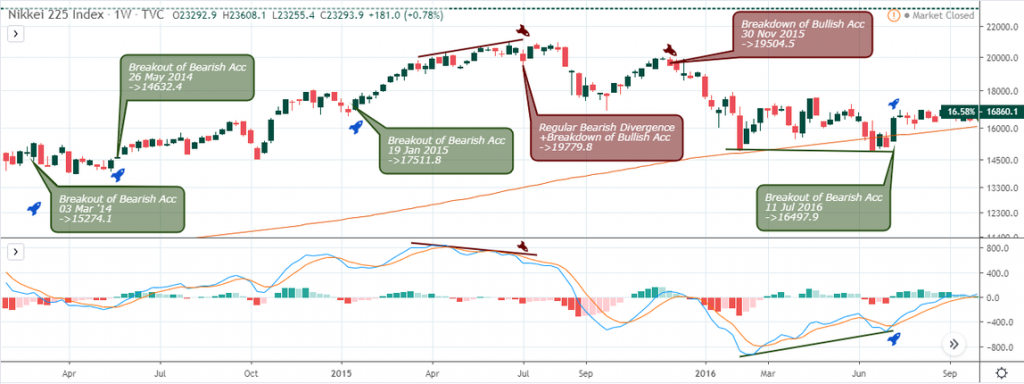
The Chinese stock market crash of June 12, 2015, started with a regular bearish divergence on the weekly chart of the Nikkei 225 Index.
A breakdown of bullish accumulation on November 30, 2015, confirmed the price plunge to the MA-200 on the weekly chart.
An opposite regular bullish divergence on July 11, 2016, concluded the price bottom as the price broke above hidden bearish accumulation resistance on the same date.
Stock Market Selloff August 18, 2015
The stock market selloff played out between the years 2015 through 2016, starting from the drying up of demand, revealed through regular bearish divergence patterns on March 9, 2015, and May 2015, and finally plunged on August 18, 2015.
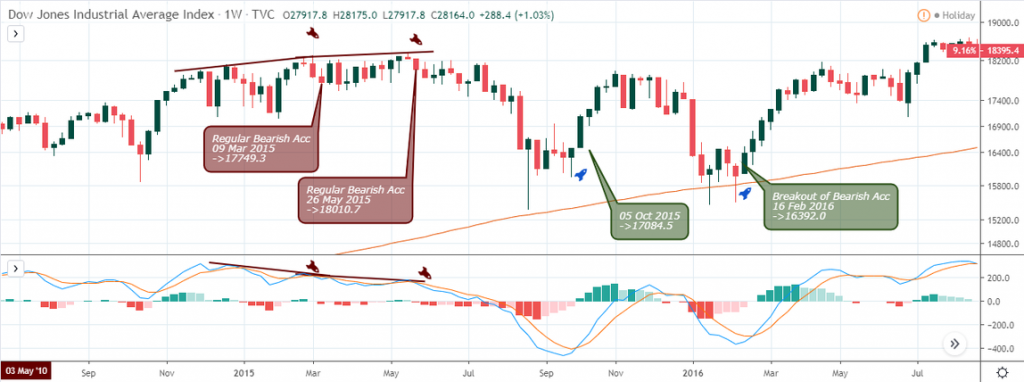
A double bottom pattern formed on the MA-200 confirmed the bottoming of the crash and consequently resumed the bullish price rally on February 16, 2016.
World-Wide Stock Market Downturn September 20, 2018
The worldwide stock market downturn was one sharp and sudden one ignited by a double top chart pattern alongside a bearish accumulation pattern on October 10, 2018, after an earlier 7.64% price hike.
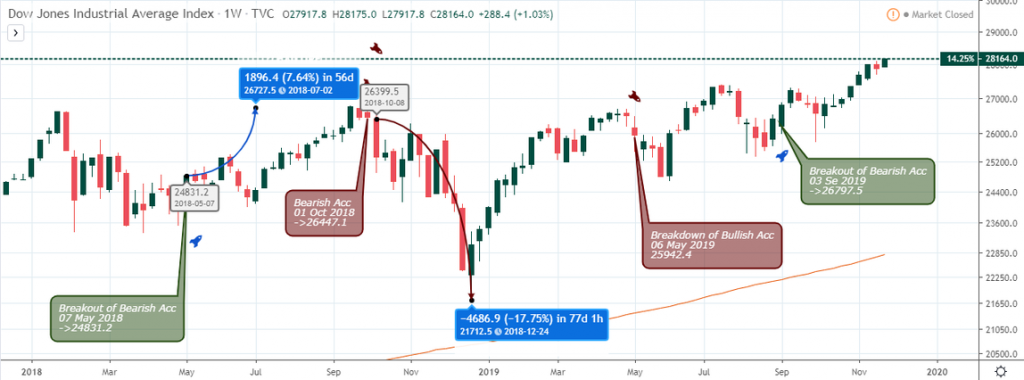
The DJI price plunged by 17.75%, but couldn’t establish new lows upon hitting the MA-200.
Conclusion
To conclude, you’ll observe that a higher percentage of the analyze stock market crashes were triggered by bearish divergence patterns where the price plummets below the 200-period Moving Average.
With that said, we must pay attention to this trend reversal or in other cases, trend continuation patterns.
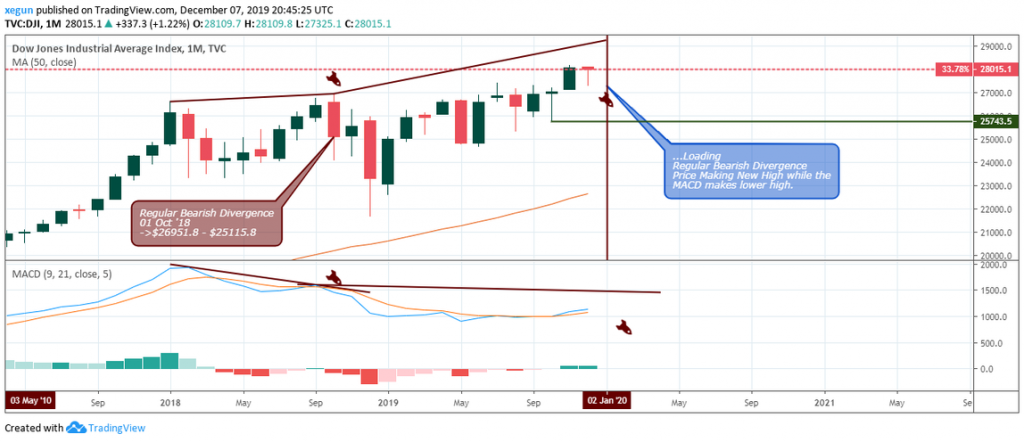
From our analysis, we’ve come to see that a sequence of regular bearish divergence often leads to a market crash way below the 200-period Moving Average.
Therefore, the monthly chart of the DJI below showing a buildup of a second regular bearish divergence pattern after the last one on October 01, 2018, may confirm Ray Dalio’s analysis of an impending crash in the not too distant future.
Disclaimer
Content provided by CryptoTraderNews is for informational purposes only, and should not be construed as legal, tax, investment, financial, or other advice. All information is of a general nature. As always, there is risk with any investment. In exchange for using our products and services, you agree not to hold CryptoTraderNews Pro, its affiliates, or any third party service provider liable for any possible claim for damages arising from decisions you make based on information made available to you through our services.
[/wlm_private]
Want to read the rest of the article? Join our pro-membership and receive all of the following:
✅Access to ALL content.
✅Access to the CTN editorial staff.
✅Access to our CTN trading dashboard.
✅Access to our exclusive telegram channel where all our pro-members and editorial staff are in.
✅Ability to request content/research material!
1 comment
[…] Stocks […]
Comments are closed.