
In this article, we’ll be going way back in time to analyze the bearish and long bullish phase of gold versus the US Dollar trend that qualifies it as a store of value, identifying the basic chart patterns driving the XAUUSD trend.
[wlm_private “Crypto Trader Pro – Monthly|Crypto Trader Pro – Yearly|Crypto Trader Pro (Lite)”]
Long Term Price Overview
We’ll be carrying out all our analysis from the monthly time frame, identify the significant resistance, support, bullish and bearish reversal patterns charting the course of time.
XAUUSD Monthly Time Frame 1996-2002
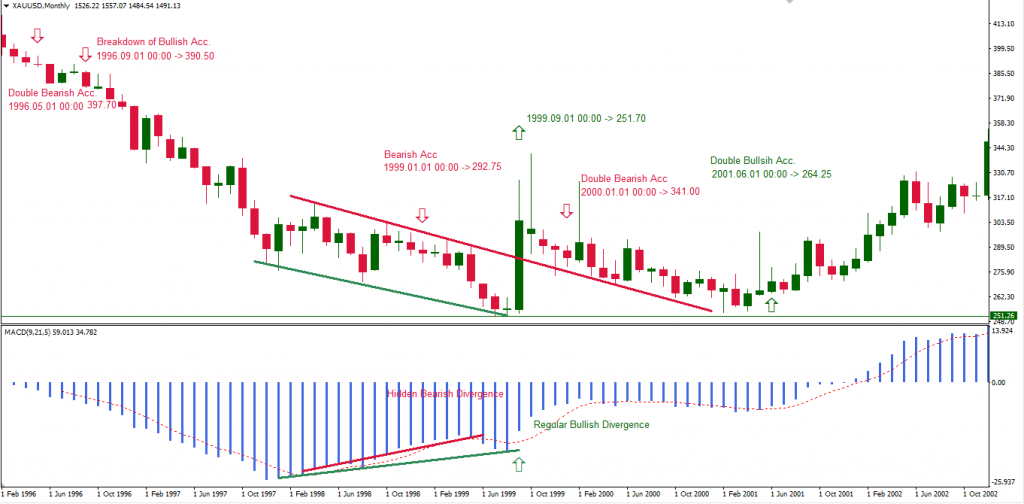
The above monthly time frame shows the early days of Gold, signaling a double bearish accumulation pattern on January 1996, and setting resistance at $397.70, before a breakdown of bullish accumulation on September 1996 ($390.50).
After a hidden bearish divergence pattern on January 1999 ($292.75), the bulls flagged an opposite regular bullish divergence pattern on September 1999 ($251.70), ushering in the beginning of a long upbeat campaign.
Trading above the previous declining trend line from the bearish divergence, the bulls again found support at $264.25 in June 2001, resuming the Bull Run.
XAUUSD Monthly Time Frame 2001-2007
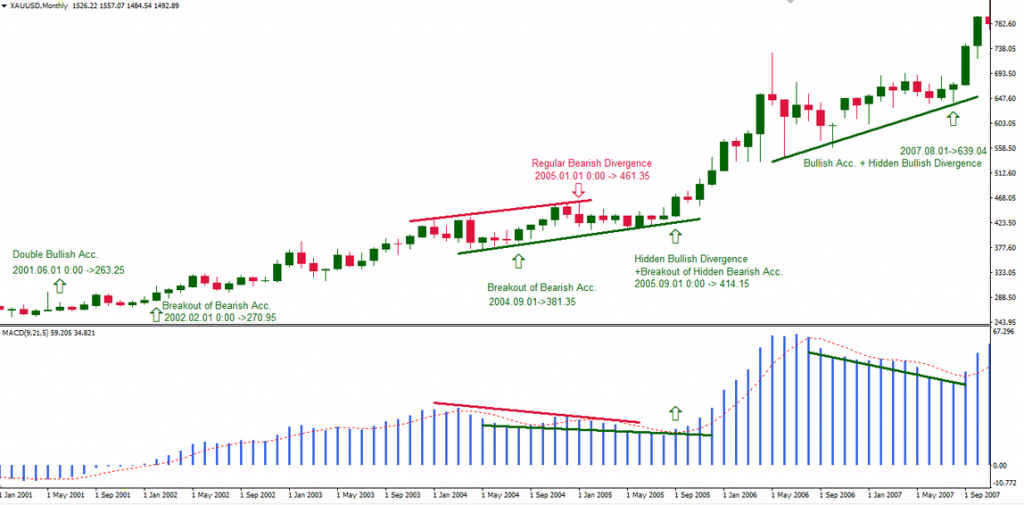
After finding support at $263.25, the XAUUSD continued to establish higher troughs from bullish signals in the form of a breakout of bearish accumulation resistance on February 2002 ($270.95), September 2004 ($381.35), and a hidden bullish divergence in September 2005 ($415.15).
The increase in buying power continued with the bulls breaking through resistance levels and triggering another hidden bullish divergence pattern in August 2007 ($639.04).
XAUUSD Monthly Time Frame 2007-2014
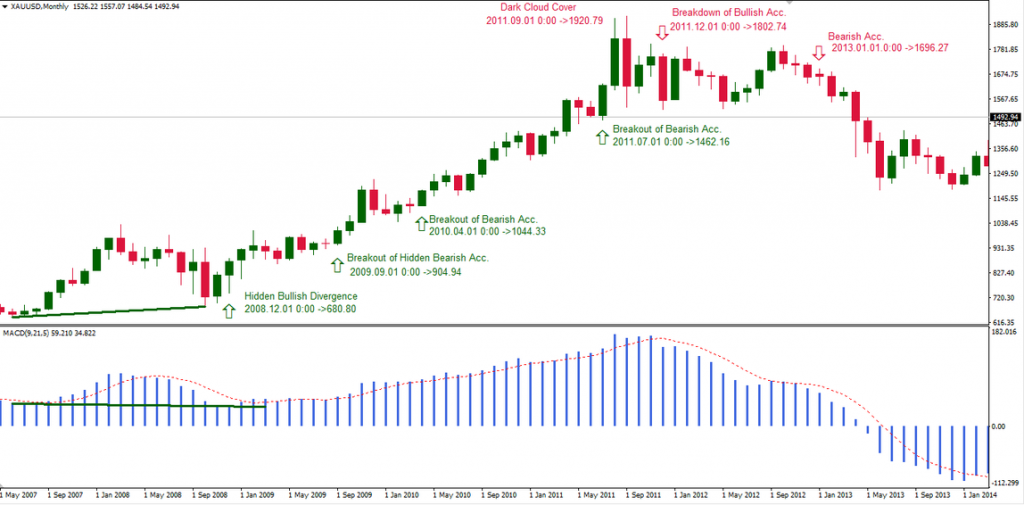
The bullish campaign continued with another hidden bullish divergence pattern in December 2008 ($680.80) making the third bullish divergence setup in the bullish rally.
Again, the bulls force their way above bearish accumulation resistance levels on September 2009, April 2010, and July 2011, setting support levels at $680.80, $904.94, $1,044.33, and $1,462.16 respectively, before the bears slowly inched into significant support levels, driving the price south.
The XAUUSD exchange rate increased by about 217% before the bears came in.
The bearish activity started from a breakdown of support on December 2012, setting resistance at $1,802.74 after a dark cloud cover candlestick pattern flagged on September 2011. As the bearish move continued, the XAUUSD signaled another bearish accumulation resistance on January 2013, setting support at $1,696.27.
XAUUSD Monthly Time Frame 2012-June 2019
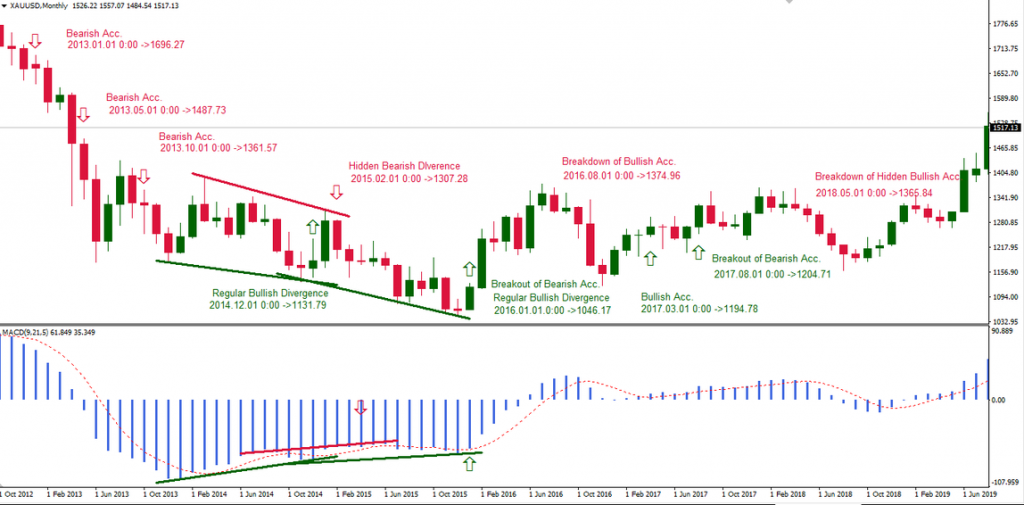
The bearish trend lasts for about 52 months for a price decline of roughly 36% from the dark cloud cover candlestick pattern.
Towards the end of the price plunge, the price entered a parabolic cycle, flagging alternating bullish and bearish divergence patterns in December 2014, February 2015, and January 2016.
The bulls flagged the last regular bullish divergence in combination with a breakout of bearish accumulation, establishing a sound support level at $1,046.17, as the price continued to set up higher lows at $1,122.46, and $1,159.97.
XAUUSD Monthly Time Frame 2015-Present Day
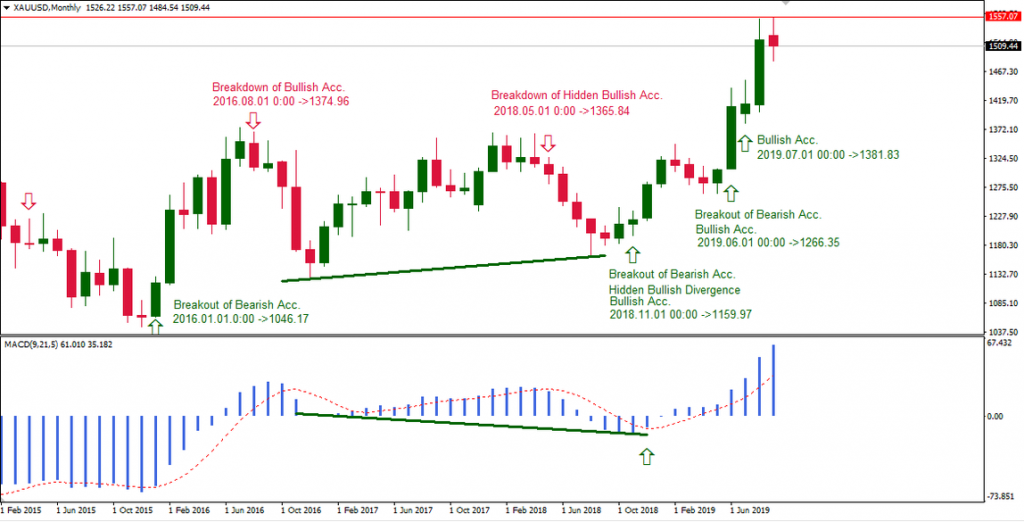
The XAUUSD price formed a higher low on November 2018, while the MACD oscillator established lower highs at $1,159.97, reinforcing the confidence to enter a long position on the pair.
Re-entry signals in the bullish direction flagged on June 2019 and July 2019, setting support at $1,266.35 and $1,381.83 respectively.
Conclusion
Reference to the historical data available to us in this post, Gold is slowly coming out of what appears to be its most prolonged bearish correction, proving itself as a hedge against economic uncertainties in the world. A price close above the all-time high of $1,920.79 will confirm an increase in demand and dominance of Gold.
Disclaimer
Content provided by CryptoTraderNews is for informational purposes only, and should not be construed as legal, tax, investment, financial, or other advice. All information is of a general nature. As always, there is risk with any investment. In exchange for using our products and services, you agree not to hold CryptoTraderNews Pro, its affiliates, or any third party service provider liable for any possible claim for damages arising from decisions you make based on information made available to you through our services.
[/wlm_private]
Want to read the rest of the article? Join our pro-membership and receive all of the following:
✅Access to ALL content.
✅Access to the CTN editorial staff.
✅Access to our CTN trading dashboard.
✅Access to our exclusive telegram channel where all our pro-members and editorial staff are in.
✅Ability to request content/research material!