
In this post, we will analyze the long-term price and trends of Bitcoin (BTC) from 2011 to the present day.
Bitcoin (BTC) is often referred to as the digital gold for Millenials and there’s been ongoing debates as to whether its volatility qualifies this number one cryptocurrency by market capitalization as a safe-haven against the future global economic crisis.
[wlm_private “Crypto Trader Pro – Monthly|Crypto Trader Pro – Yearly|Crypto Trader Pro (Lite)”]
Long-Term Price Overview
We start with the monthly time frame as it gives a bird-eye-view of the early trend buildups, showing reversal patterns that have shaped the structure of the cryptocurrency market.
BTCUSD Monthly 2011-2013
Below is a close snapshot of the monthly chart showing the significant levels breached for the first Bitcoin BTC bullish campaign.
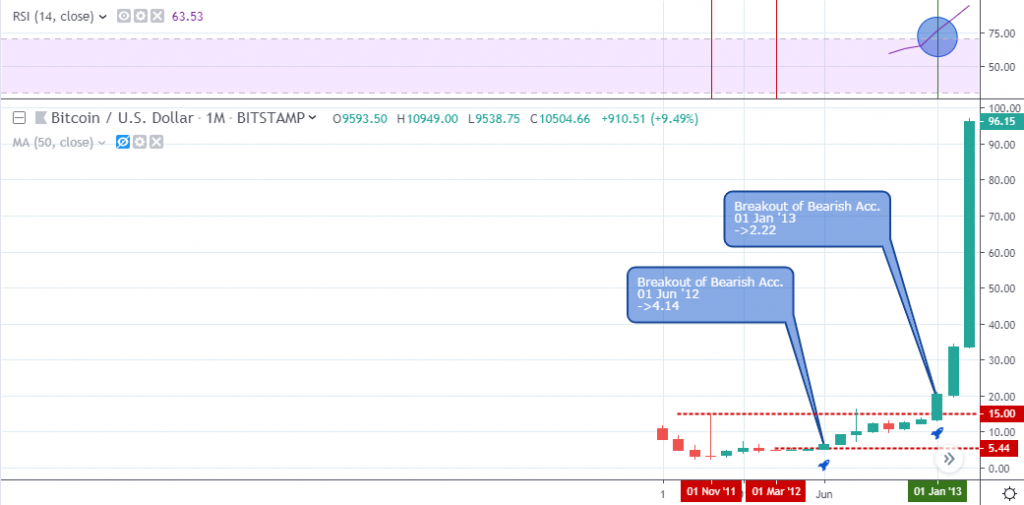
Starting with bearish accumulation patterns in November 2011 and March 2012, the bears set up resistance at $15.00 and $5.44. A bullish campaign launched that led to a break above resistance on June 01, 2012 (2891.0%), and January 01, 2013 (1077.7%).
BTCUSD Monthly 2012-2017
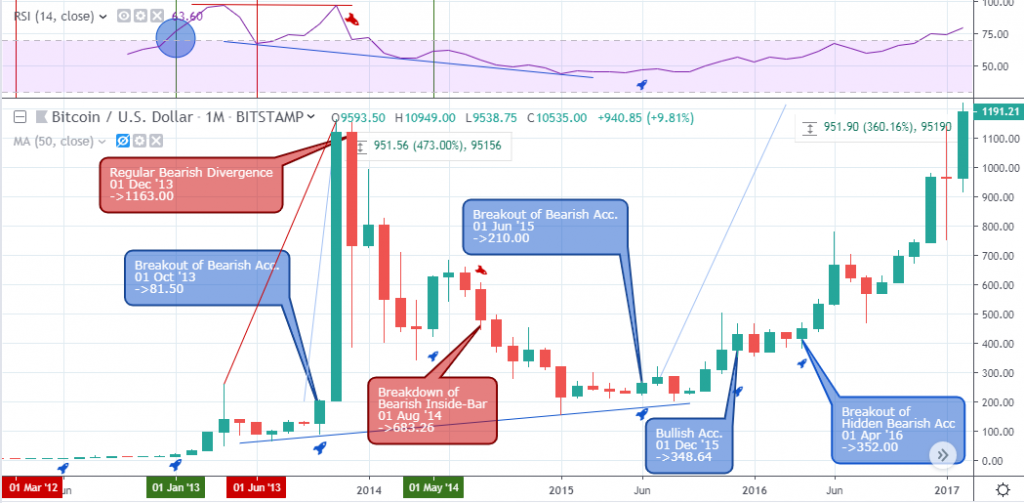
After the first price surge in 2012, BTC price corrected the gains, to form a bearish accumulation pattern in June 2013. Slowly but surely, the bulls again sneaked on the bears and broke above the bearish accumulation resistance ($128.86) on October 2013.
The hanging-man candlestick pattern on December 2013, confirmed the regular bearish divergence pattern that led to the roughly 18 months bearish trend. A breakout of bearish accumulation and hidden bullish divergence in June 2015 restored the price of Bitcoin into a bullish trend, with a support setup at $210.0.
The price increased by about 360.15% as the bulls offered opportunities to scale in on December 2015, and April 2016 shown above.
BTCUSD Monthly 2011-Present Day
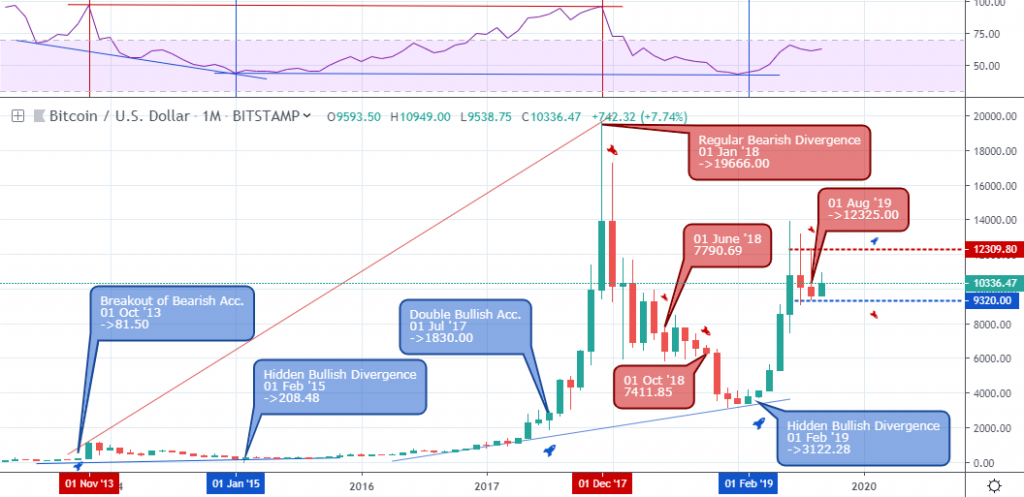
Above is a bird’s eye illustration of the monthly time frame showing the entire life span of Bitcoin BTC vs. USD.
Following a formation of hidden bullish divergence on February 2015, the most extended upbeat campaign of the Bitcoin price launched, which last for about 34 months; the longest spanning regular bearish divergence flagged on January 2018, after establishing the all-time high of $19,666, which lead to the price crypto-winter of 2018.
Similar to the hidden bullish divergence pattern in February 2015, BTCUSD signaled a hidden bullish divergence confirmed by a breakout of bearish accumulation ($4,265.0) on April 2019.
Bitcoin’s price has increased by about 162.0% from the April 2019 breakout level. In the meantime, the bears establish resistance at $12,325 to drive the current price corrections further south before resuming the bullish trend.
However, a close above the $12,325 bearish accumulation resistance would confirm an earlier than expected price continuation, given the current state of the price chart.
Next, we move on to the weekly time frame, where we identify the other patterns on that time scale.
BTCUSD Weekly
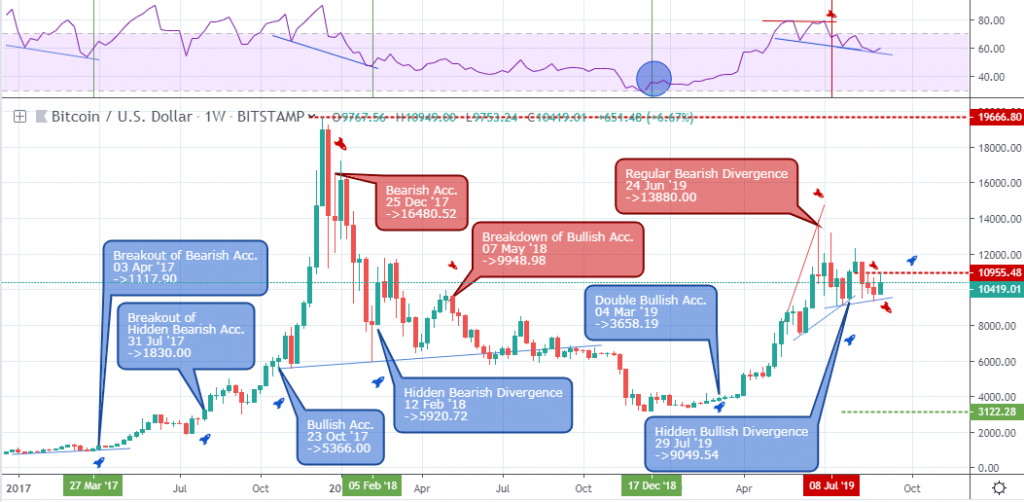
The bullish divergence pattern on April 03, 2017, and breakout of hidden bearish accumulation on July 31, 2017, fueled an increase in demand for Bitcoin in 2017.
On December 25, 2017, the bears set up resistance at $16,480.52 as the price exited the overbought area. Attempts to restore the bullish trend on February 12, 2018, collapsed to an increase in selling pressure via a breakdown of bullish accumulation on May 07, 2018.
Upon exiting the oversold area on December 17, 2018, the bulls slowly increased their dominance, driving the Bitcoin BTC price higher by about 254.0%.
Below, we conclude by looking at the scenarios that could play out considering the recent price patterns on the monthly and weekly time frame.
Conclusion and Possible Scenario
The formation of bearish accumulation patterns on both the August monthly and August 26, 2019 weekly time frames prove a strong presence of sellers in the Bitcoin market. We may experience a price breakdown, before a price breakout in a bullish direction.
A price close above the $10,955.48 resistance is a scenario for a price hike.
Disclaimer
Content provided by CryptoTraderNews is for informational purposes only, and should not be construed as legal, tax, investment, financial, or other advice. All information is of a general nature. As always, there is risk with any investment. In exchange for using our products and services, you agree not to hold CryptoTraderNews Pro, its affiliates, or any third party service provider liable for any possible claim for damages arising from decisions you make based on information made available to you through our services.
[/wlm_private]
Want to read the rest of the article? Join our pro-membership and receive all of the following:
✅Access to ALL content.
✅Access to the CTN editorial staff.
✅Access to our CTN trading dashboard.
✅Access to our exclusive telegram channel where all our pro-members and editorial staff are in.
✅Ability to request content/research material!