
The first quarter of the BTCUSD ended with a bullish outlook despite a bearish closing first month. Let’s do a quick recap of significant technical price patterns and important news events in Q1.
Analyst Opinions
Options Analyst: A Sharp increase in Bitcoin Price for 2019 is rather Unlikely
Emmanuel Goh, a former derivatives trader at JP Morgan Chase, in an interview with MarketWatch said that crypto options market currently sees a doubling in daily volume since earlier this year.
Goh said there is a 5% probability of Bitcoin attaining $10,000 by September, following a $10k September expiry priced at 5 deltas.
[rml_read_more]
Options trading, a form of trading that allows traders to speculate on the possibilities of an asset getting to a specified level, is quickly becoming popular in the cryptocurrency space.
Fundstrat’s Tom Lee on Bitcoin’s Price Breakout
Tom Lee, an analyst for Fundstrat in the first quarter, said if Bitcoin price holds above the $4000 level it will cross the MA-200 by August, then he went further to project a 5 to 6 months period before Bitcoin can be confirmed to be in a bull market.
Speculative Adoption
CME: March Last Trade 29 March 2019
March 29 was the last trade date of Bitcoin futures for the month, as well as for the first quarter where all trading ended at 4 PM GMT. This event is significant as it often serves as a reference point for evaluating technical price patterns on higher time frames of the BTCUSD.
A delay in Bitwise and VaneEck’s Application for Bitcoin ETF by the US Securities and Exchange Commission (SEC)
The US SEC has suspended its resolution towards revising the rules of the Securities Act which will allow the listing of Bitcoin (BTC) exchange-traded funds (ETF). This decision was made public on March 29.
Upcoming Events
Bitcoin Security Token Summit 08 April 2019
This event, as stated on the securitysummit.com website, is a 500 participant only event. It is a premier summit for Digital Securities on the Blockchain at the Ritz Carlton in downtown Los Angeles U.S.
The organizers have drawn a tentative agenda for the event on the conference home page.
A few of such talks at the event include
- Security Tokens and Investment Funds.
- FIRST! The First Four Tokenized Venture Capital Funds
- Custodians, Broker-Dealers and Transfer Agents in a Tokenized Economy.
- Security Token Issuance Platforms & the Promise of Liquidity.
- Compliance, Accounting and Record Keeping.
- Navigating the Minefield: Rules & Regulations Surrounding Tokenization.
- Tokenizing, Trading & Investing Globally.
- Taking Real Estate into the Future: Blockchain & Tokenization.
- The Age of Tokenization: Decentralization VS. Regulation.
BTCUSD: Monthly
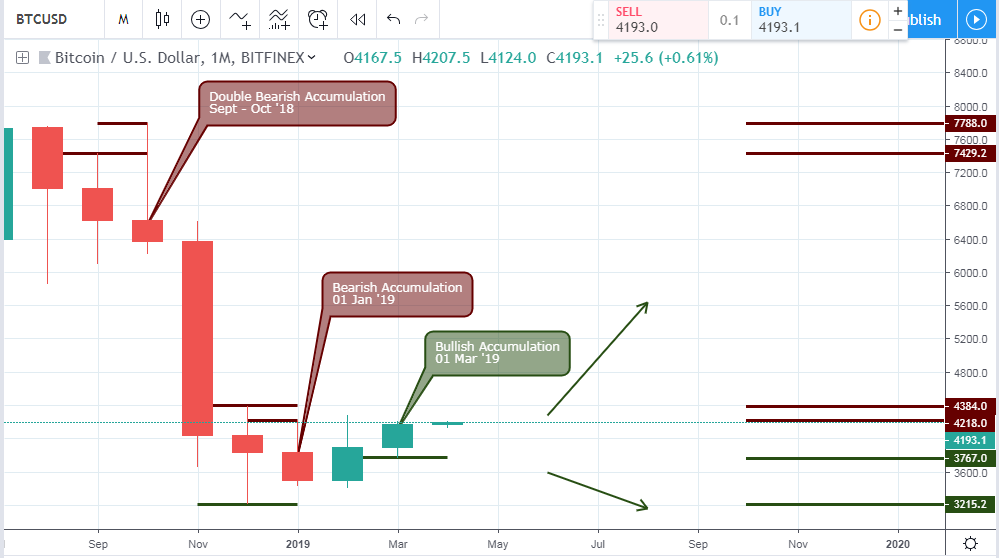
Following a double bearish accumulation that triggered a sharp decline of the bitcoin price in Q4 of 2018, the pair again moved into another double bearish accumulation as we entered the New Year 2019. The bearish accumulation pattern intensified the bearish sentiment by establishing strong resistance levels at $4384.0, and $4218.0.
As many have anticipated, the month of March closed bullish within the high-low range of February, signaling a bullish accumulation pattern and for the first time, we see a switch from bearish to bullish sentiment on the monthly chart.
BTCUSD: Daily
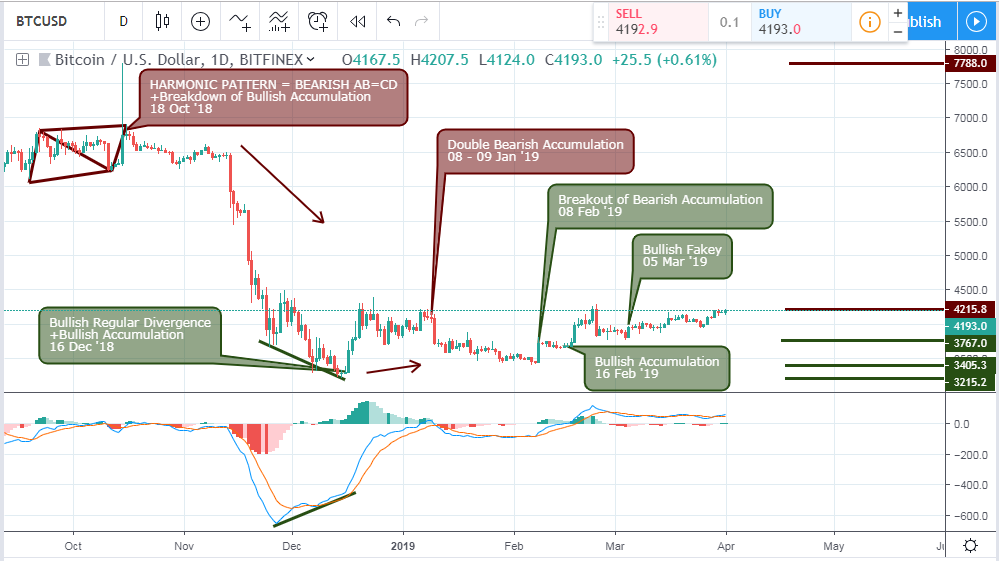
The above daily chart shows a rapid 51.0% drop in Bitcoin price triggered by a bearish AB=CD Harmonic pattern. A breakdown of bullish accumulation confirms the harmonic pattern on the same date, thereby reinforcing the probability of taking a short only trade.
On December 16 ’18, a bullish regular divergence pattern was triggered in combination with a bullish accumulation, setting the stage for the current bullish rally we see at the beginning of Q1 2019. The initial bullish rally ended after a double bearish accumulation pattern was triggered on 08 and 09 ’19, which sent the pair correcting the bullish trend by approximately 16.2% from the signal.
Midway into the first quarter, the pair break out of a bearish accumulation pattern on 08 February ’19 signaling a continuation of the bullish trend.
BTCUSD: 4HR
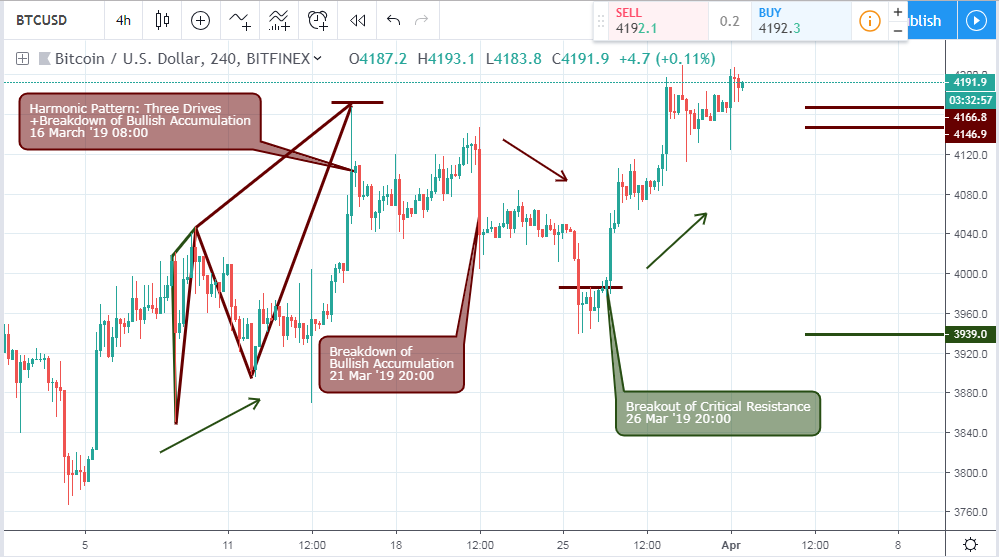
As illustrated on the above 4hour chart, a Three Drives bearish harmonic pattern is signaled on 16 March ’19 08:00. The pattern was reinforced by a breakdown of bullish accumulation in the same period of the harmonic pattern as the Bitcoin price nosedived by 3.3%. Although the bearish decline did not last for long, it was an opportunity for taking profit in a long trade and entering a short term sell.
The breakout of a critical resistance level of $3980.5 initiated the current bullish trend shown on the 4 hour chart.
Conclusion and Projection
The monthly chart of the BTCUSD finally shows potentials for a bullish rally presenting an opportunity to enter long only trade with low risk, as the critical resistance levels of $4384.0 and $4218.0 are not yet breached.
A bullish price close above the mentioned resistance levels from a monthly chart overview will present more opportunities to scale into the bullish trend and capture more profits towards the upside.
Featured image by Marco Verch