
Did you know that the term “spike” was introduced from early trading days on the market floor when trade order slips were written on paper and punched on a metal spike at the end of a trade. In modern day reference, a “spike” refers to a sudden price uptick or price plunge. A historic spike would be the market crash of October 19, 1987, when the Dow (DJIA) plummeted by 22% in one day.
Spikes within the crypto market often occur after a crypto pair stays in a range for a period time. To better understand it, let’s show you an example to better understand and anticipate a spike using technical indicators and candlestick patterns.
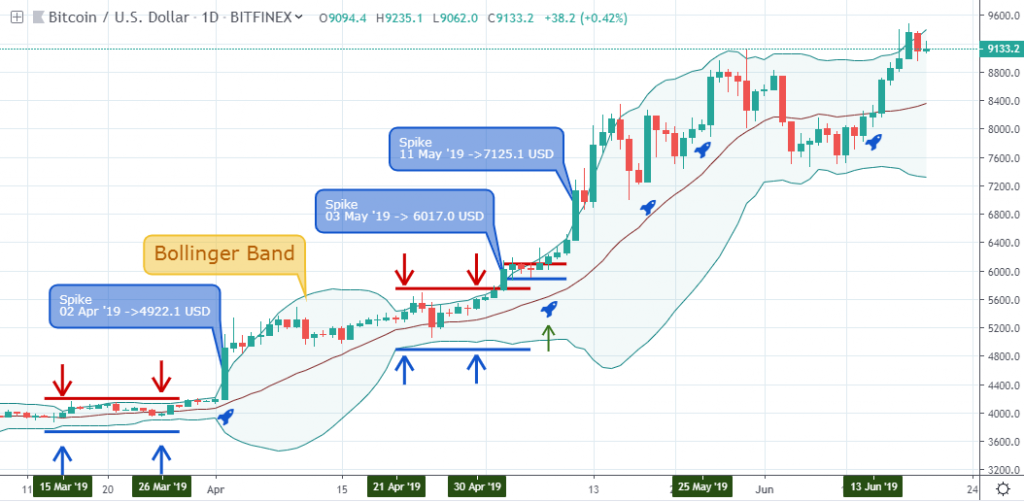
The Bollinger Band
[rml_read_more]
The above daily chart of BTCUSD illustrates a Bollinger squeeze, which often acts as a perfect location for traders to anticipate a spike.
Notice how the BTCUSD candlestick chart entered a squeeze between 15 March ’19 and 26 March ’19, right before the spike became apparent and took effect on 02 April ‘19.
A similar squeeze can be seen between 21 April and 03 May, which traders and investors could speculate that a spike is about to take place.
Breakout of Bearish and Bullish Accumulation
Breakouts of bearish accumulation like the one on 08 May can also prepare a trader for a price spike.
Following a breakout of bearish accumulation resistance of 6102.0 USD on 06 May, the price of BTCUSD eventually spiked upwards on 11 May ’19.
Bullish and Bearish Accumulation
A bullish or bearish accumulation pattern is signaled when a recent candlestick, or child-bar, trades in the same direction as the earlier candlestick, referred to as the mother-bar, where we can see the current candle closes within the high low range of the mother-bar.
Notice the spike after a bullish accumulation pattern signaled on 25 May ’19 and another on 13 June ’19.
Trading in the direction of a Spike
The spike may be an anomaly if the cryptocurrency trading setup returns to the average trading range. However, if the price continues in the same direction as the Spike as shown on the above daily chart, then it represents an optimistic interpretation of the technical, or macroeconomic, pattern in question.
The crypto analyst can then proceed further to take a position in the same direction.
Summary
- Spikes are a quick and sudden increase in the price of an asset.
- A spike can be of either bearish or bullish variant.
- Price spikes can be an anomaly when the price returns to the average range of the asset after the event and can be normal when subsequent closing candlesticks close above it.
- It often takes place after a price consolidation of a crypto asset and can be anticipated by deploying a Bollinger band indicator.
- Other ways of anticipating a price spike are after a signaled bearish or bullish accumulation price pattern.
- Spikes can be used as a quick profit taking the opportunity when adopting a scalp trading strategy, by anticipating a good entry point and long term trend from an early surge in price.
Disclaimer
Content provided by CryptoTraderNews is for informational purposes only, and should not be construed as legal, tax, investment, financial, or other advice. All information is of a general nature. As always, there is risk with any investment. In exchange for using our products and services, you agree not to hold CryptoTraderNews Pro, its affiliates, or any third party service provider liable for any possible claim for damages arising from decisions you make based on information made available to you through our services.