In technical analysis, what is a bull trap?
Also known as a bullish Fakey pattern, the bull trap is a false signal that gives the impression of a bullish recovery in price following a long bearish signal.
As the name implies, it lures crypto traders and investors who followed the bullish price surge and traps them at a higher price, generating considerable losses in cases where no risk or money management was deployed as a safeguard.
A bull trap/Fakey pattern may also occur in a bullish trend, taunting the trader to open new buy orders in a bullish “rally” that often follows a price collapse.
Trader and investors often buy above the resistance level of an asset because they believe the price will continue in the same direction of the breakout, but they must try to intuit a second price close above the high of the earlier bullish rally as confirmation of the anticipated upbeat swing.
[rml_read_more]
Candlestick patterns such as the Doji candlestick pattern can show indecision in the market, which is a good sign that a bull trap may be lurking in the background.
Failure of bullish support to hold an upbeat, mainly due to profit-taking, may allow bears to come in and drive the price south upon seeing bearish divergence. Such a move often triggers pending orders and stop-loss order of bulls, which may lead to a price plummet or whipsaw.
Spotting a Bull Trap
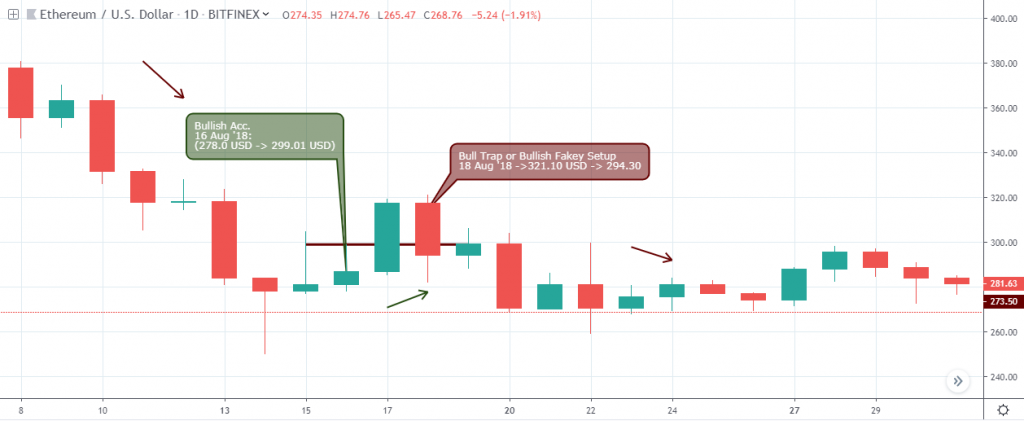
Bull Trap – ETHUSD Daily Chart

The above daily chart of ETHUSD shows the pair coming out of a bearish trend that started from August 10 ’18. The pair signaled a bullish accumulation pattern giving an idea of bullish trend recovery.
Following a break above the bullish accumulation resistance of 299.01 USD on August 17 ’18, the bears forced the price below the resistance, closing at 294.30 as confirmation of the bull trap, from which point, the bears continued to push the pair further south. In the chart, you can see how the price remained below the resistance level through the end of the month.
Even at press time, the price of the Ether (ETH) still trades below the 321.10 USD high of the bullish trap. Taking an opposite short trade after exiting the bull trap trade will not only help avoid the loss from a bearish decline but also offer potential long term profit.
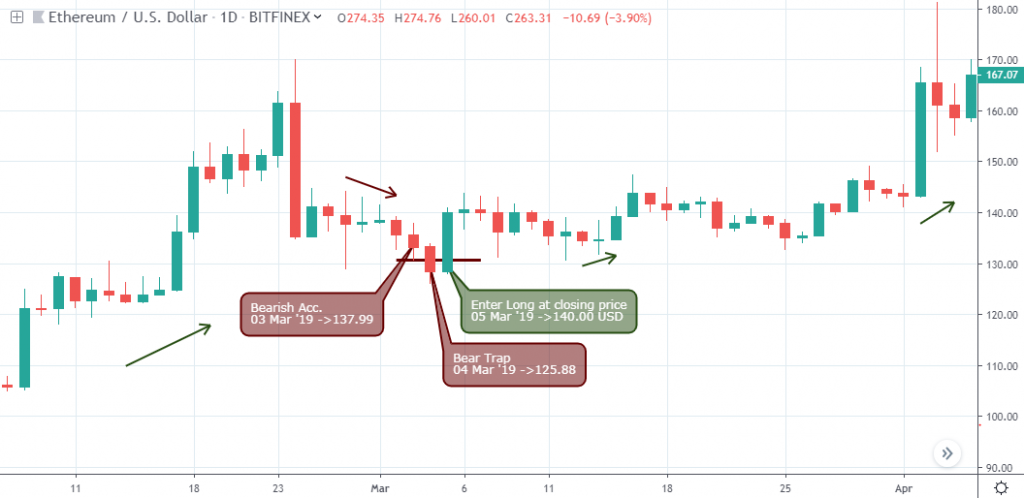
Bear Trap – ETHUSD Daily Chart

The above chart is a bearish trap setup which is opposite of the bullish trap. Notice after signaling a bearish accumulation pattern on March 03 ’19, the bears tried to force the price south on March 04 ’19, which was a trap. The bullish closing candle on March 05 ’19 closed above the bearish accumulation support at 140.0 USD sending the price of the ETHUSD into a bullish trend. The price has not returned to that price level.
Summary
A bull trap is generally a false trend reversal pattern that forces participants of an asset class into the wrong side of a price action.
It occurs when the buyers refuse to continue a rally in an upward direction and sustain established supports.
A different variant of the bull trap is the bear trap which occurs when buying pressure overwhelms selling pressure which often prompts traders and investors into dumping their position.
As a trader, you can avoid falling into a bull trap if you understand the patterned buildup as described in this post.
Disclaimer
Content provided by CryptoTraderNews is for informational purposes only, and should not be construed as legal, tax, investment, financial, or other advice. All information is of a general nature. As always, there is risk with any investment. In exchange for using our products and services, you agree not to hold CryptoTraderNews Pro, its affiliates, or any third party service provider liable for any possible claim for damages arising from decisions you make based on information made available to you through our services.
