When it comes to trading, whether its commodities, fiat, and cryptocurrency, it is vital to know how to read the charts, know how to interpret support and resistance patterns and understand market trends in order to have the best chance of gaining a profit from your investments.
It may surprise you that individual traders and hedge funds have different ideas on how cryptocurrency support and resistance levels should be determined. We’re going to walk you through some basic explanations of support and resistance through the chart illustration below.
[rml_read_more]
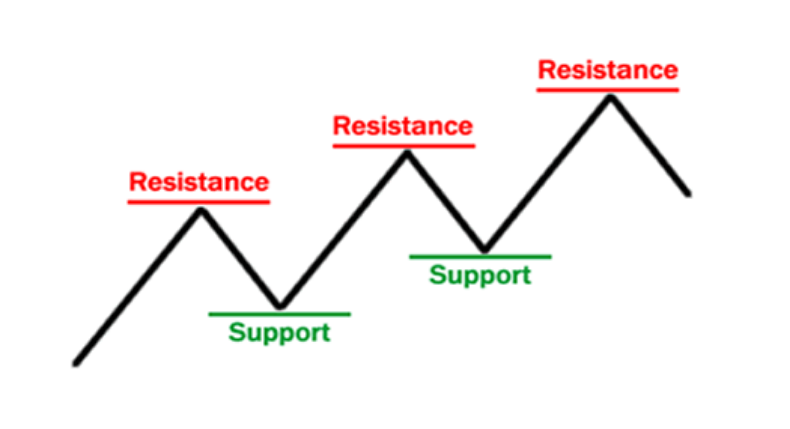
Notice the peaks and troughs on the chart represent resistance and support levels in the illustration. In a given time frame, resistance is often referred to as the ceiling, or roof, from which the asset price does not close above, and the support level is the floor which the asset’s price does not close below.
The illustration shows the “zigzag” movement indicating a bullish trend as the support levels between the ceiling and floor increase over time. One thing to bear in mind is that cryptocurrency markets usually form both resistance and support levels as its price oscillates on different time horizons.
The question is then, how do we identify support and resistance levels, and how do we know if the support and resistance is breached?
Due to the high level of subjectivity in determining support and resistance levels, we came up with a measurable way of identifying resistance and support levels through candlestick pattern formation. Plotting support and resistance on a candlestick chart does help to find these pockets of movement. The pattern we find highly reliable here is bullish and bearish accumulation price patterns.
These patterns show buying and selling pressure in the cryptocurrency market, as well as the switch from resistance to support when prices close above a critical resistance or support level.
Bullish Accumulation
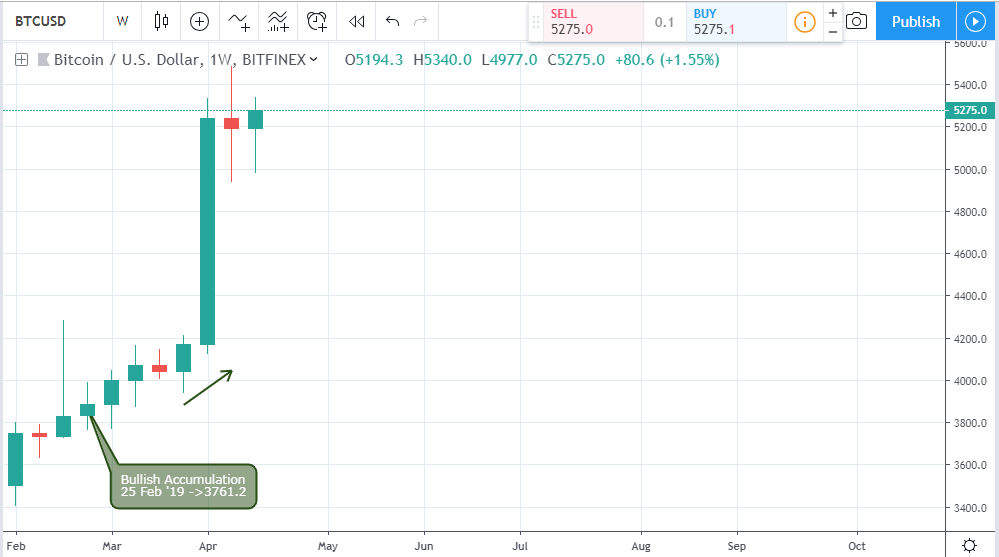
Look at this pattern. It represents bullish or bearish pressure and is triggered when a child bar closes in the same direction as the mother bar, but within the high low range of the mother bar as shown on the chart above.
In the case of the bullish accumulation setup, the support is the low of the child bar at $3761.2.
Criteria for Bullish Accumulation Support
To be confirmed as a bullish accumulation setup, the bullish candle body of the child bar must close within the high low range of the mother bar and in the same direction as the mother bar.
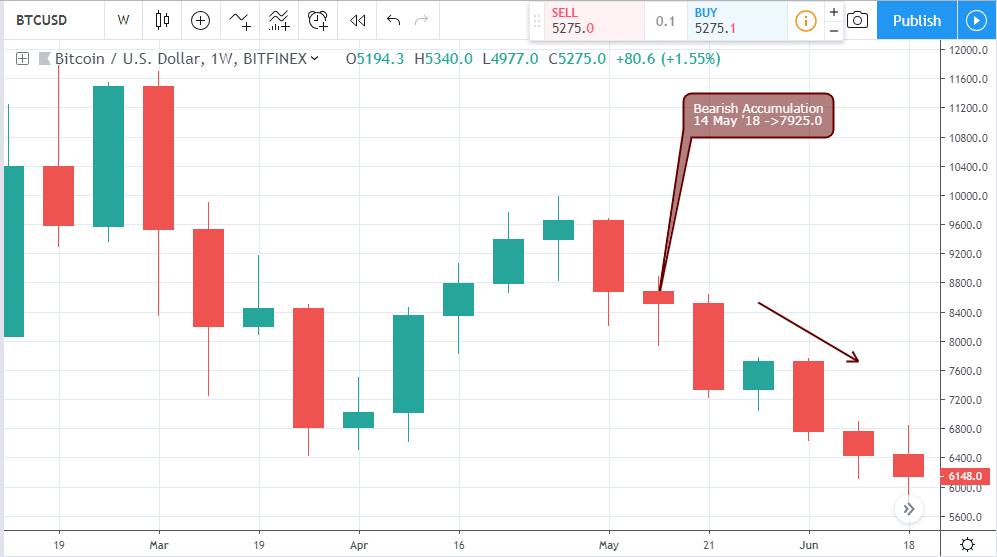
The opposite of bullish accumulation support is the bearish accumulation resistance where the child bar closes bearish as the mother bar, with a resistance level at the high of the child bar.
Criteria for Bearish Accumulation Resistance
To be confirmed as a bearish accumulation setup, the bearish candle body of the child bar must close within the high low range of the mother bar and in the same direction as the mother bar.
The bearish accumulation resistance on the above chart is at 7925.0.
Change in Polarity
A price close above or below a resistance and support level is deemed a “Change in Polarity.”
You will see in the chart below that this formation is also identified by the failure of bullish and bearish accumulation, or pressure, resistance or support.
Breakdown of Bullish Accumulation
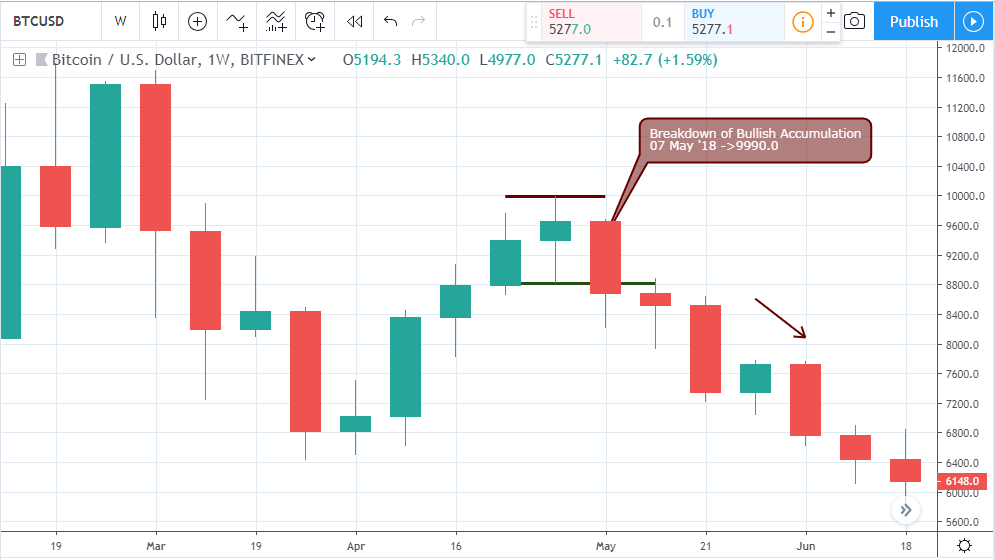
Be aware that bullish accumulation supports do not always succeed in driving price in the same direction. Sometimes an increase in selling pressure may lead to a collapse of the bullish support hence a change in polarity from support to resistance.
The breakdown of bullish accumulation is flagged when the price closes below the low of the bullish child bar thereby indicating rejection of bullish sentiment. Opposite to the breakout of bullish accumulation is a breakout of bearish accumulation which indicates a failure of bearish pressure, as indicated above on the BTCUSD monthly chart.
This pattern is flagged when bullish closing candles breach the child bar resistance level of the bearish accumulation pattern; an indication of an increase in bullish pressure/volatility.
Breakout of Bearish Accumulation
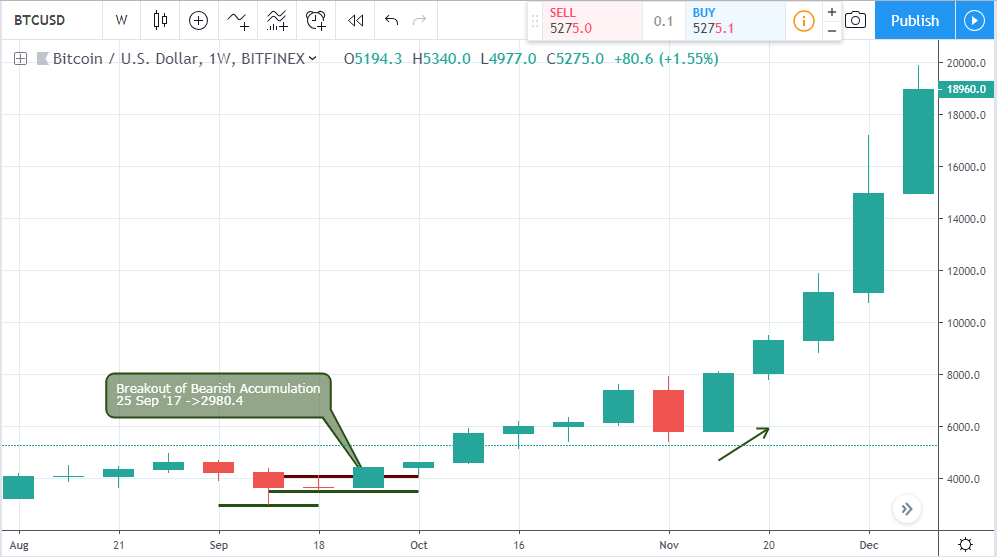
The second variant of the change in polarity is a breakout of bearish accumulation.
The signal for a switch in polarity tends to occur following an increase in buying pressure when a bullish closing candle breaches the child bar resistance level of the bearish accumulation pattern (see chart above).
A change in polarity from resistance to support or vice versa, using candlestick patterns such as the ones mentioned above, often results in a series of bearish or bullish closing bars after the price break.
Bounce off Support
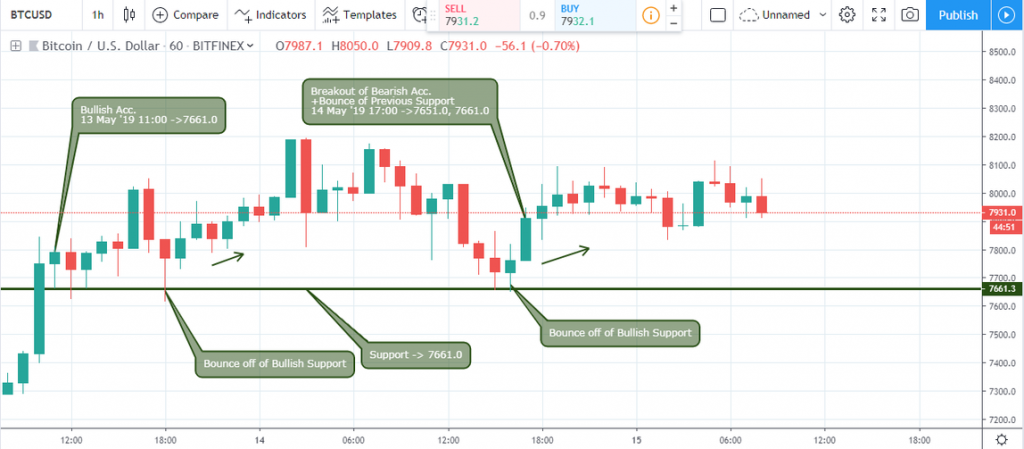
When price approaches a previously formed resistance or support, it could bounce off such levels.
In the chart, you can see a bullish accumulation pattern was signaled on May 13 2019 11:00 establishing support at $7661.0.
To this point, all attempts to force prices below this level has not yet been successful as the price bounces above the level upon impact.
On May 14 2019 17:00, the BTCUSD signaled a breakout of bearish accumulation resistance on an earlier formed bullish accumulation support, showing the strength of the $7661.0 support level.
Disclaimer
Content provided by CryptoTraderNews is for informational purposes only, and should not be construed as legal, tax, investment, financial, or other advice. All information is of a general nature. As always, there is risk with any investment. In exchange for using our products and services, you agree not to hold CryptoTraderNews Pro, its affiliates, or any third party service provider liable for any possible claim for damages arising from decisions you make based on information made available to you through our services.