
Following the bullish rally that stretched through the crypto market, we begin to see price retracements, which indicates that traders are taking profit from their long positions. Bitcoin continues to hold on to major support levels even in the face of a negative news report that concerns Bitfinex and Tether, while other altcoins show weakness and possible bearish price decent.
Read on as we analyze the technical price patterns driving the trend of some major altcoins.
Bitcoin (BTC)
The recent bearish trend in the market has seen a lot of investors suffer huge money loss. Notably among those to lose a reasonable sum is Japanese billionaire, Masayoshi Son. The seasoned investor and founder of SoftBank Group lost roughly $130 million trading Bitcoin.
A recent survey conducted by London-based publication FStech across 10 European countries shows that while many people consider Bitcoin to be digital gold, only 49% of those respondents think that BTC will still be in existence in ten years. This reveals that for cryptocurrencies to remain viable, it will have to evolve further in order to be accessible and friendly to the non-tech savvy public.
[rml_read_more]
Daily Chart
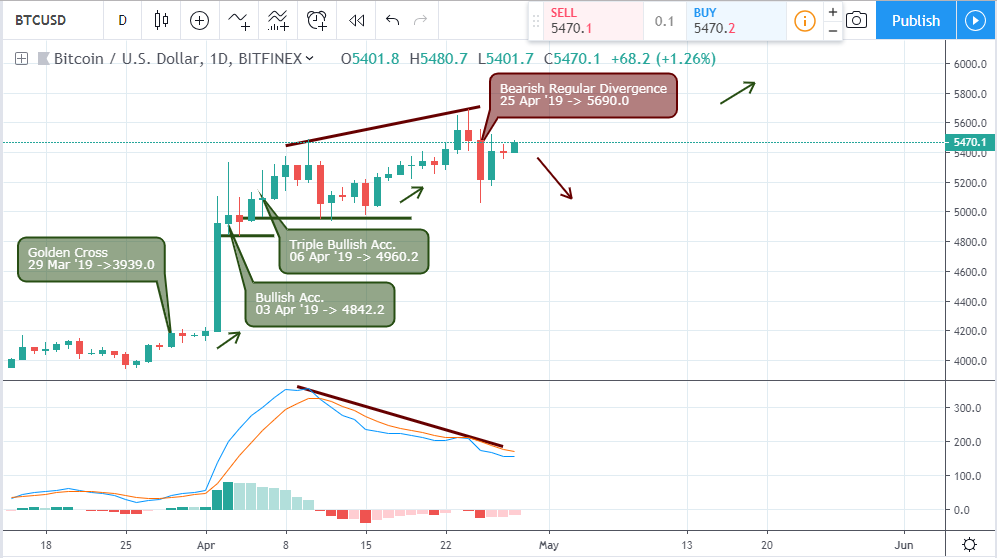
The bulls maintain their position even in the face of adverse news involving Bitfinex and Tether. This news matches with a bearish divergence pattern on 25 April ’19 sadly the bears could not sustain the initiative as the intraday time frames which we’ll later come to see signals a recoil of the bearish volatility.
4-Hour Chart
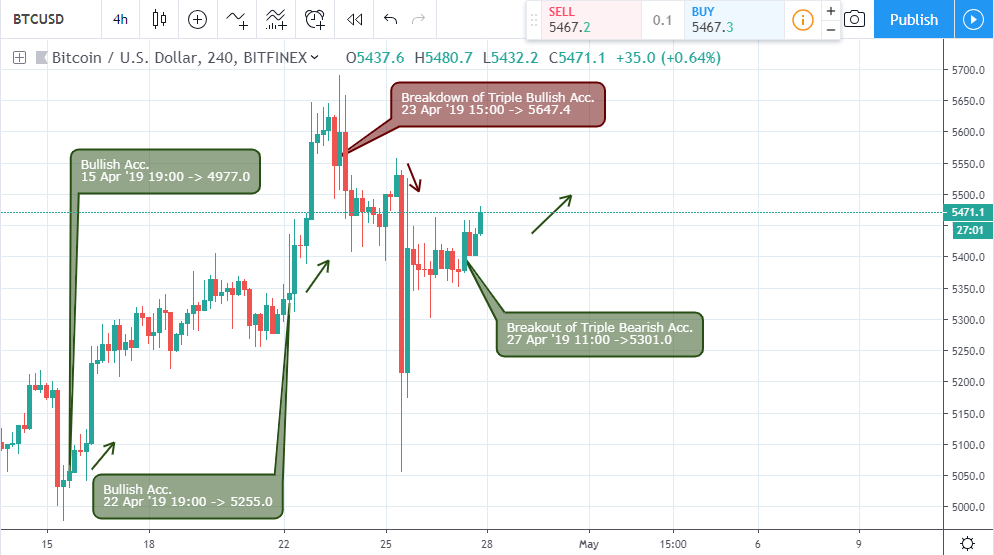
An overview from the above 4-hour chart resulted in a 12.53% bullish rally following a bullish accumulation pattern on April 15 ’19 19:00, fixing support at 4977.0. Later on April 23 ’19 15:00, the bears took over the market after a price breakdown of triple bullish accumulation support, sending the price falling by 8.7%. The bulls have been resilient as they forced the price of Bitcoin to spring back up after making support of 5055.0, and subsequently breaking out of bearish accumulation resistance on April 27 ’19 11:00.
1-Hour Chart
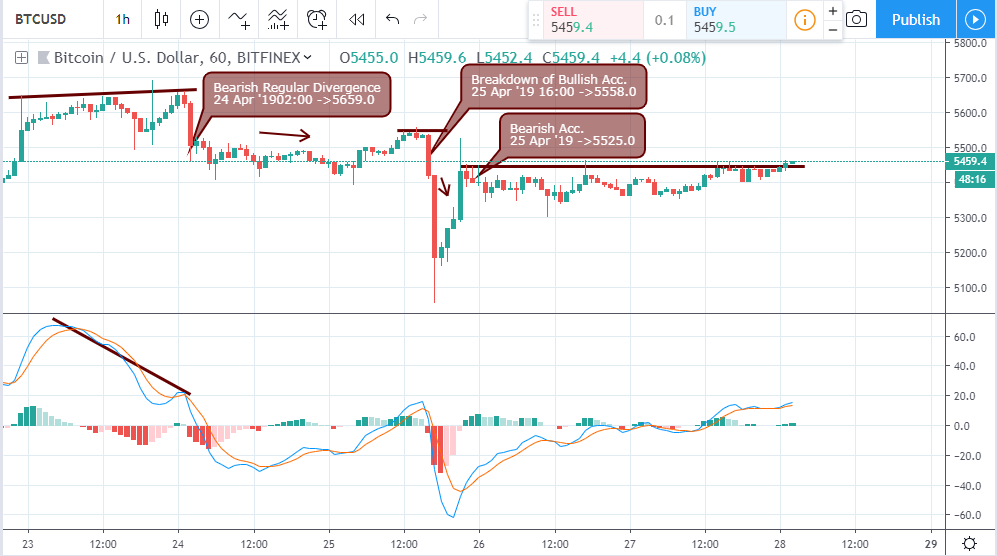
The bearish regular divergence pattern flagged on April 24 ’19 02:00, in sequence with the collapse of bullish accumulation on the 4-hour chart, increased the bearish view. On 25 April ’19 16:00, a breakdown of bullish accumulation was signaled and sent the pair crashing down by 6.65% from the signal point, after which the price recoiled in the opposite bullish inclination.
Ethereum (ETH)
Reports surfaced recently that Samsung is set to build a public-private blockchain that is established on Ethereum. The blockchain is anticipated to be dubbed Samsung Coin.
Also, Ethereum’s co-founder has proposed an increase in Ether staking rewards once the switch of the protocol to “Proof of Stake (PoS)” is confirmed.
In a disclosure this week, Ethereum developers have revealed that the required funding for a third-party audit of the ProgPoW code has been raised by them.
Good and the Bad: In good news, the Ethereum blockchain received a 100 million euro bond from Societe Generale SFH, and the bad news, a hacker reportedly succeeded in stealing approximately 45,000 ETH by guessing weak private keys.
Daily Chart
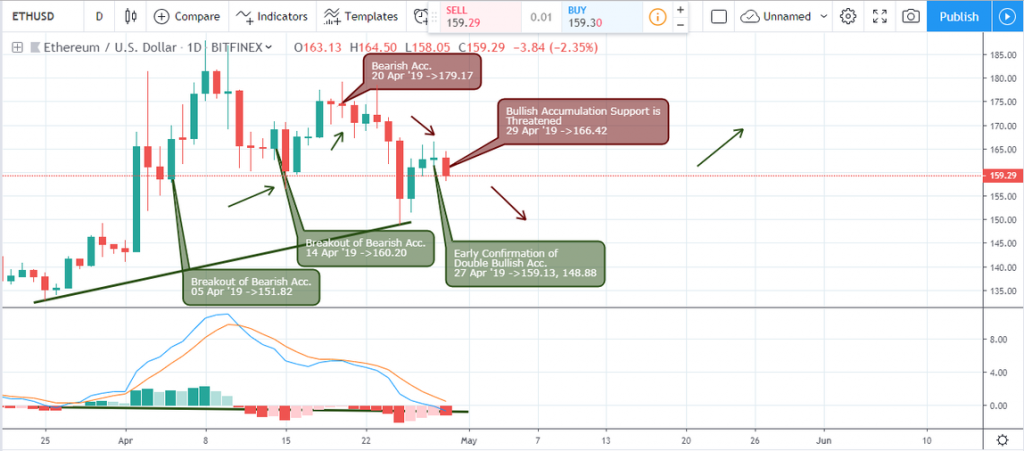
The ETHUSD started a bullish price rally after a breakout of bearish accumulation on 02 and 05 April ’19. The bears start to take over the market after a bearish accumulation pattern signaled on April 21 ’19 and setting up resistance at 129.17 as the price declined by 14.46%. A bullish hidden divergence pattern is ready for takeoff, but the bears, on the other hand, threaten the bullish accumulation support for further weakening of the price of Ether.
1-Hour Chart
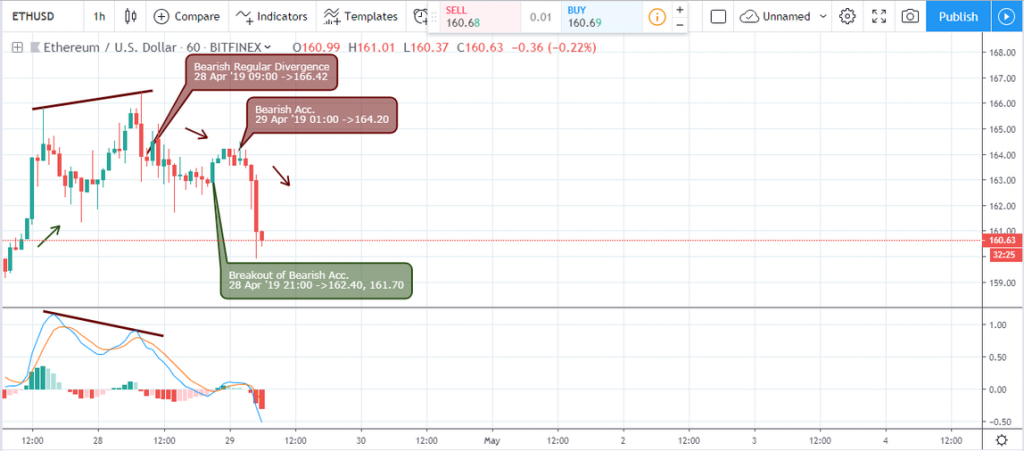
The 1-hour chart confirms a bearish accumulation pattern after a dead cross of MACD on April 28 ’19 09:00, setting up resistance at 166.42. All attempts by the bulls to restore the bullish trend failed on April 29 ’19 05:00.
Binance (BNB)
Launchpad, which is the token sale platform of Binance, has successfully concluded the sale of Matic Network (MATIC) tokens through its innovative lottery system. Approximately 58.38% of the applicants reportedly profited from the lottery.
In other news, merely a week after the launch of its own blockchain, Binance Chain, Binance has also concluded the launch of its decentralized trading platform (DEX).
The exchange company also launched its much-awaited exchange in Singapore. Its initial plan is to offer Bitcoin trading in Singapore dollars.
Meanwhile, Binance Coin (BNB) is still trading very near to its record highs.
Daily Chart
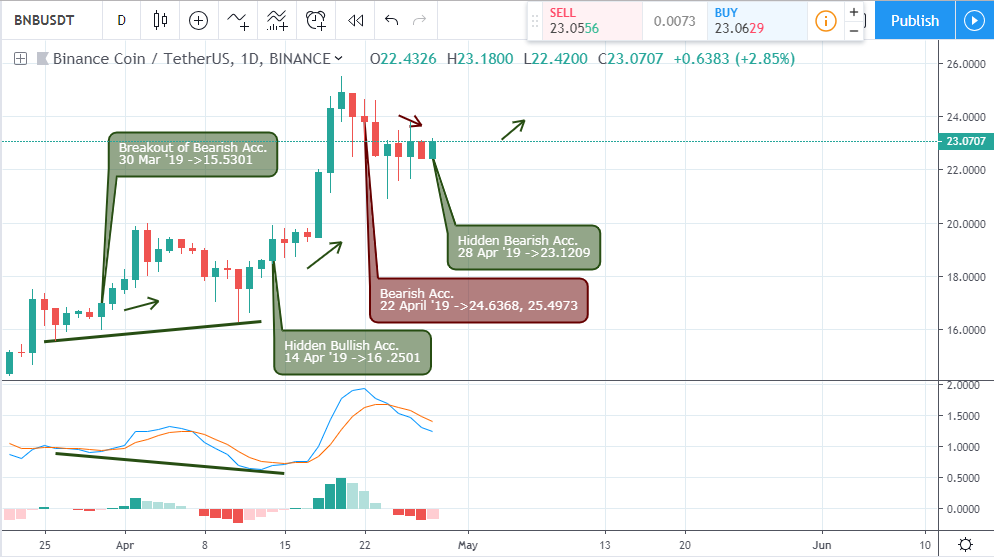
On April 14 ’19, the BNB established a bullish hidden divergence through a golden cross of the MACD as pointed on the above daily chart. A bearish accumulation pattern signaled on April 22 ’19 launched the price into a 50% correction.
4-Hour Chart
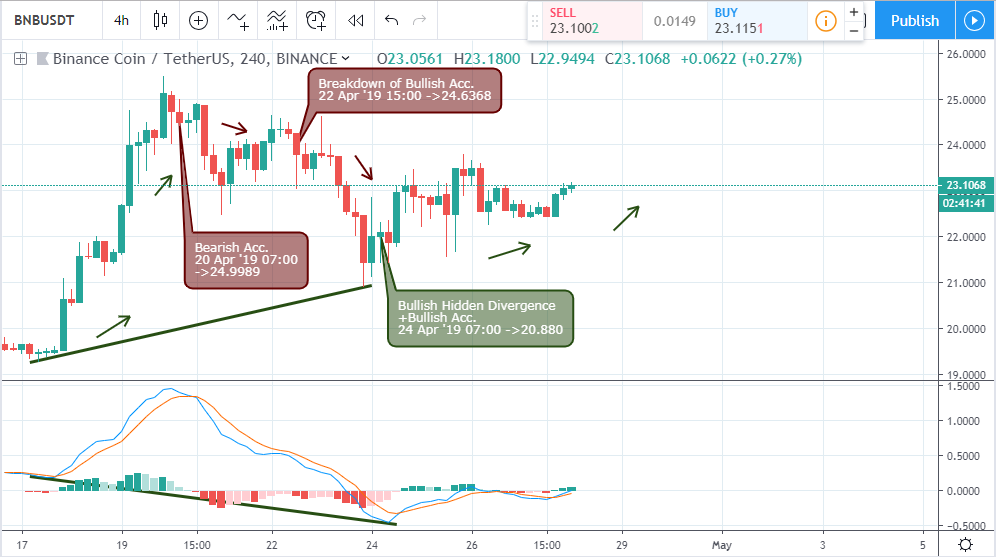
The above 4-hour chart shows a breakdown view of the daily chart price retracement, by signaling a bearish accumulation on April 22 ’19 and a failure of bullish accumulation on April 22 ’19 15:00. A bullish divergence pattern indicated on April 24 ’19 07:00 was confirmed by a bullish accumulation pattern on the same day.
TEZOS (XTZ)
Investors were buoyed by the comments of French Minister of Finance, Bruno Le Maire, on the blockchain industry and Tezos. In an interview, LeMaire revealed that France is considering investing over $4.5 billion Euros in innovative industries, blockchain inclusive, in the next five years.
Daily Chart
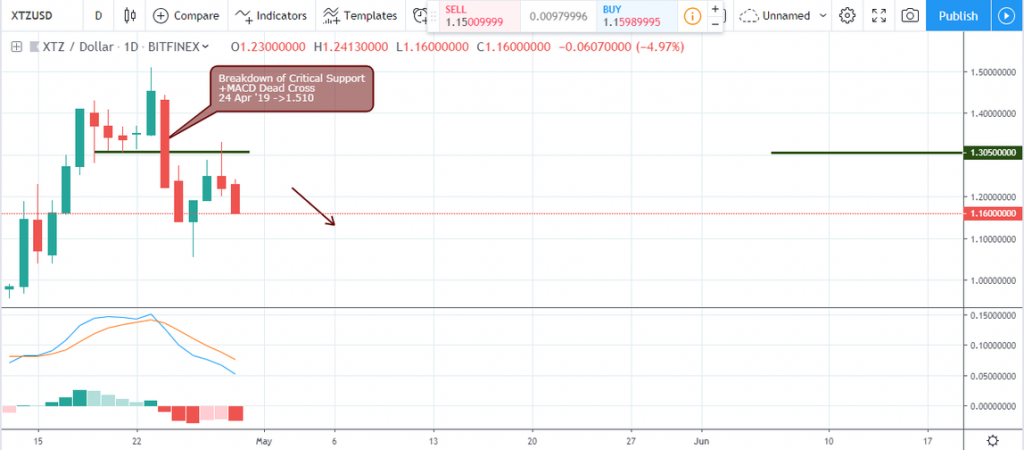
The daily time frame of the XTXUSD illustrates an end to the bullish trend following a collapse of the bullish support level on April 24 ’19. This event was simultaneously triggered with a dead cross of the MACD oscillator.
4-Hour Chart
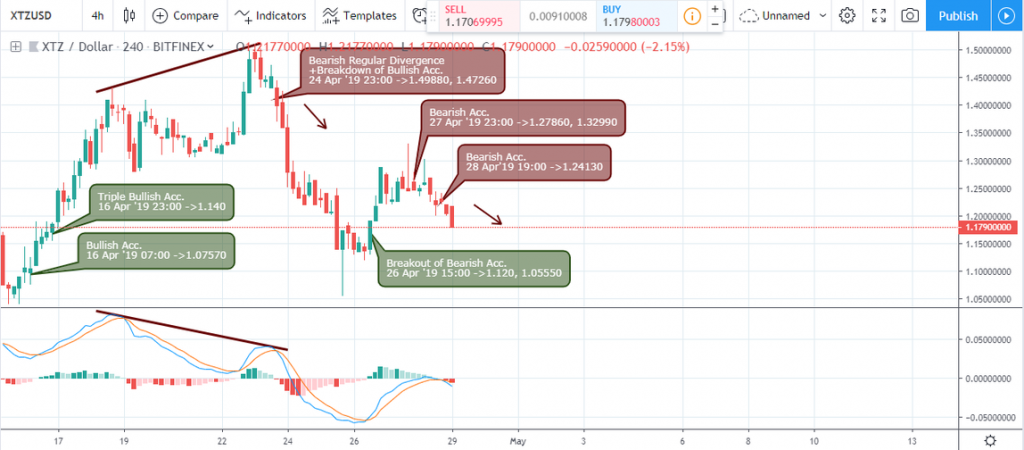
Zooming closer to the 4-hour time frame, we observe a single and triple bullish accumulation pattern on the 7th and 23rd hour of April 16 ’19 that signaled a series of bullish closing candles above. The bullish trend came to an end after firing a bearish regular divergence and breakdown of bullish accumulation on April 24 ’19 23:00. An attempt to restore the price was initiated after a breakout of bearish accumulation, signaled on April 26 ’19 15:00. The bears, however, rejected this move by signaling bearish accumulation on April 27 and 28.
Conclusion
From a general perspective, the cryptocurrency market appears to be overbought and the bulls show exhaustion mainly on the intraday level as the month gradually comes to an end. We look forward to a continuation of the major bullish trend from a monthly time frame in the new month.Disclaimer
Content provided by CryptoTraderNews is for informational purposes only, and should not be construed as legal, tax, investment, financial, or other advice. All information is of a general nature. As always, there is risk with any investment. In exchange for using our products and services, you agree not to hold CryptoTraderNews Pro, its affiliates, or any third party service provider liable for any possible claim for damages arising from decisions you make based on information made available to you through our services.