
The IMF conducted a poll on Twitter to shed light on the direction of how people will pay for lunch in five years. The poll indicates that 56% of its respondents believed that they would be paying in cryptocurrencies, while 27% believe that they will be paying by mobile phone. 9% of the respondents said that bank cards will be used, and the poll closed with 8% who believe that cash will still be used. From this, we can glean that there is a bullish sentiment toward the use of cryptocurrencies.
Over the weekend, most of the top cryptos appeared to be overbought following the bull run from last year’s low, while a few now appear to indicate a bearish outlook.
We will dive deeper to explore the prevailing technical patterns which are setting the tone for the potential trends within the crypto market.
Bitcoin (BTC)
The percentage of the total volume of Bitcoin (BTC) purchased by crypto players in April stretched to 19%, indicating that the major investors expect the bearish trend to end soon.
This increase in volume has lured Chinese traders back into action in the face of a current ban on cryptocurrency in China, perhaps launching a classic case of FOMO. Chinese traders are will to pay above prevailing prices for fees to take a position in Bitcoin using over-the-counter (OTC) services.
[rml_read_more]
The following price charts are helping to interpret these events.
Daily Chart
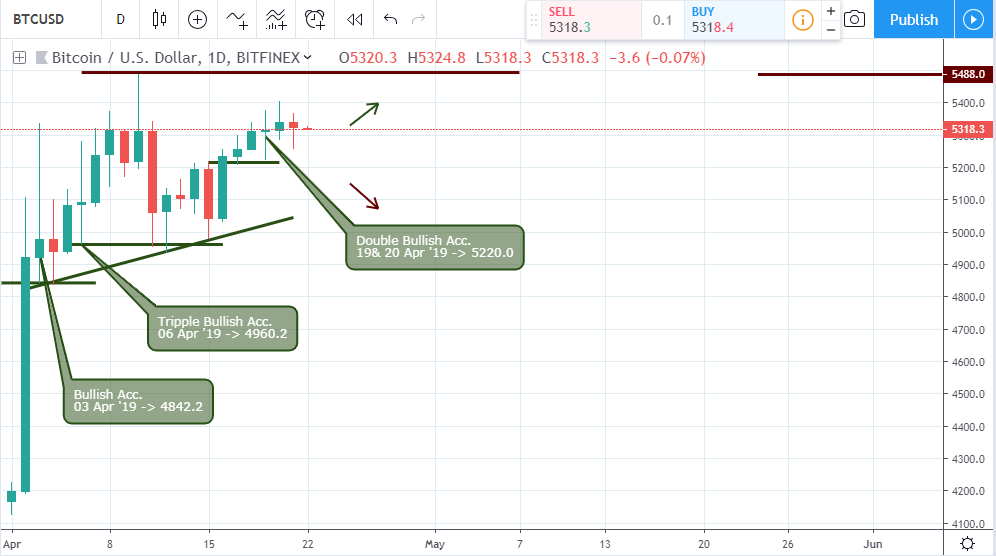
From a daily chart point of view, the BTC flags strong bullish accumulation support at 4842.20, and 4960.20 on April 03 and 06 ’19. So far, the bears have not been able to break these levels which continue to reinforce the series of bullish closing candles on the weekly time frame.
At the weekend, the pair signaled a double bullish accumulation confirming the overbought nature of BTC. Formations like this signal profit, taking the opportunity as the pair approaches the 5488.0 high.
2-Hour Chart
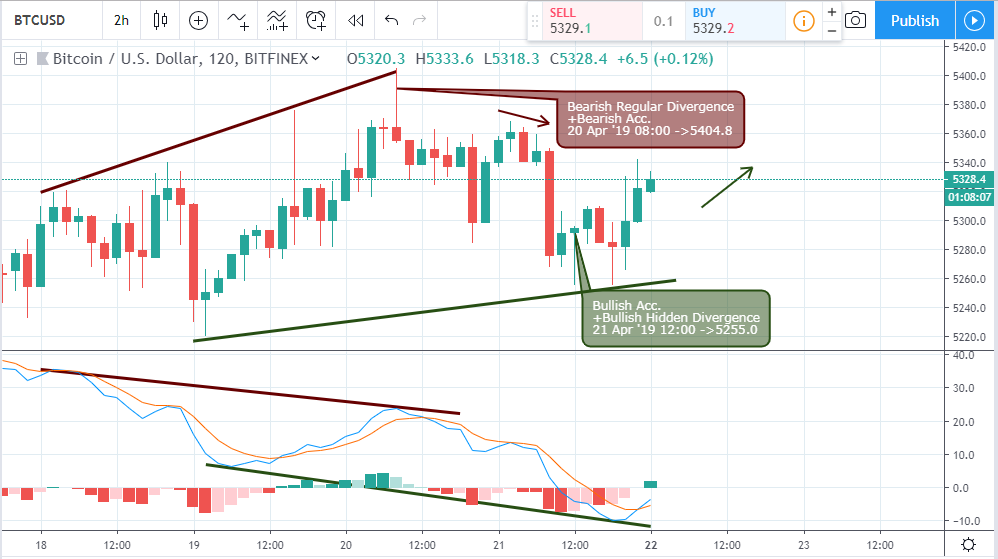
The 2-hour chart shows BTCUSD trading within an expanding bullish triangle formed by bearish and bullish divergence patterns on April 20 and 21 at the weekend. Both divergence patterns were confirmed by bearish and bullish accumulation patterns respectively. The pair maintains a bullish outlook at press time.
Ethereum (ETH)
Ether (ETH) has been added to Coincheck’s over-the-counter (OTC) service. The core developers of Ethereum are discussing whether more common and smaller hard forks are more effective than the bigger and less common hard forks. They believe that to repel the increasing competition, the decentralized platform has to be on its toes.
4-Hour Chart
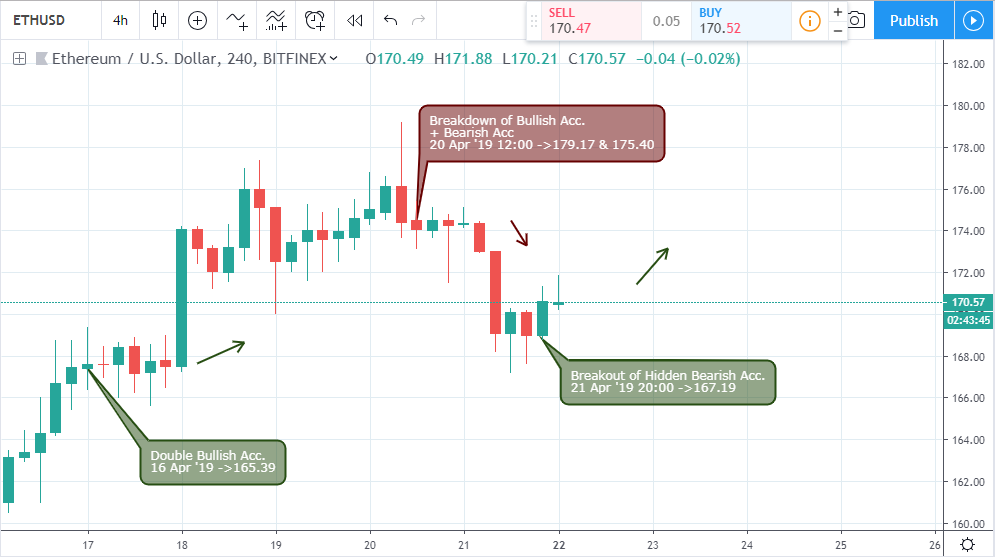
At week’s end, the bulls could not sustain their dominance as the bears crashed through bullish accumulation support of 179.17 on April 20 ’19 12:00. Coming to the end of the weekend, the pair broke out of a hidden bullish accumulation pattern on April 21 ’19 20:00 with established support at 167.19.
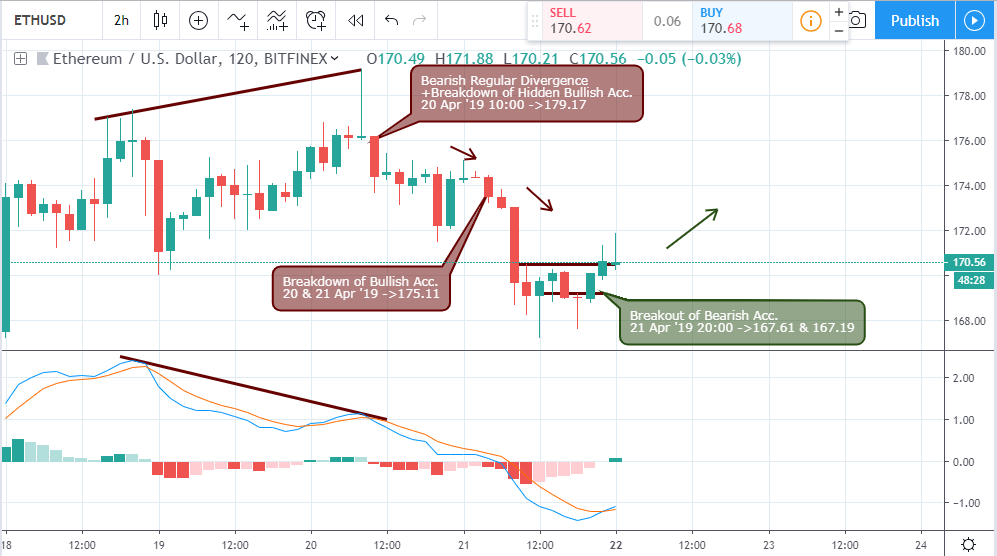
2-Hour Chart
Litecoin (LTC)
Investors had been gradually amassing Litecoin way before the bullish rally across the crypto market, which consequently drove LTC’s price by roughly 101.20%
The halving, anticipated to occur in early August, has also supported this rise. Sweden-based exchange company Nordic Growth Market has listed exchange-traded products that tell the value of Litecoin and Ripple. These products are billed to be accessible by European investors.
Daily Chart
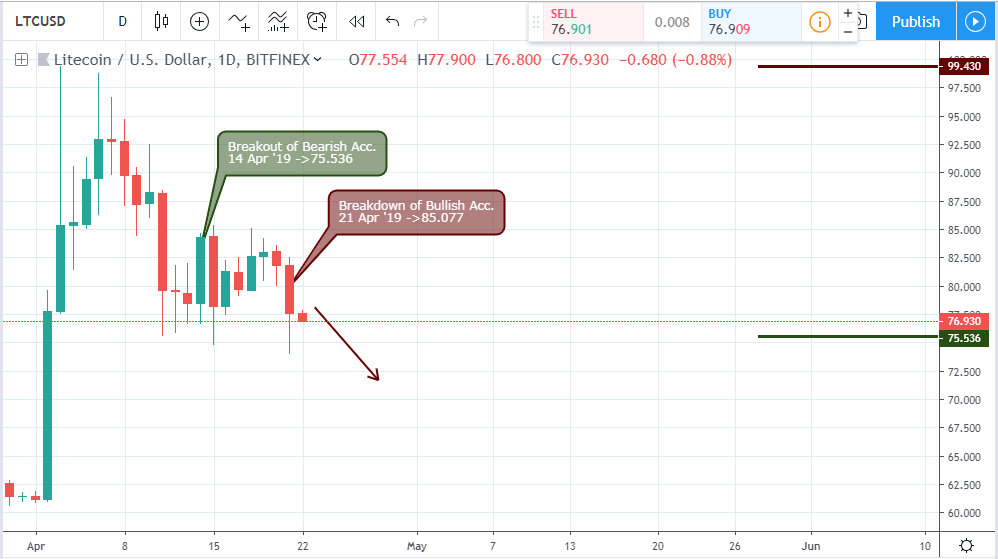
The price of Litecoin (LTC) is enclosed in a descending bearish triangle built from an alternating breakout of bearish and breakout of bullish accumulation patterns on April 14 and 21 ’19. A collapse of the 75.536 support will reinforce the bearish sentiment hence further price decline.
EOS (EOS)
Freelancing website Moonlighting has attracted investment in the tune of $5 million from FinLab EOS VC fund, a joint venture of FinLab AG and Block. The website which has over 700,000 users will now move its users to the EOS blockchain.
Co-founder of ETH and IOHK, Charles Hoskinson, criticized Ethereum and EOS for their strategy in development.
Weekly Chart
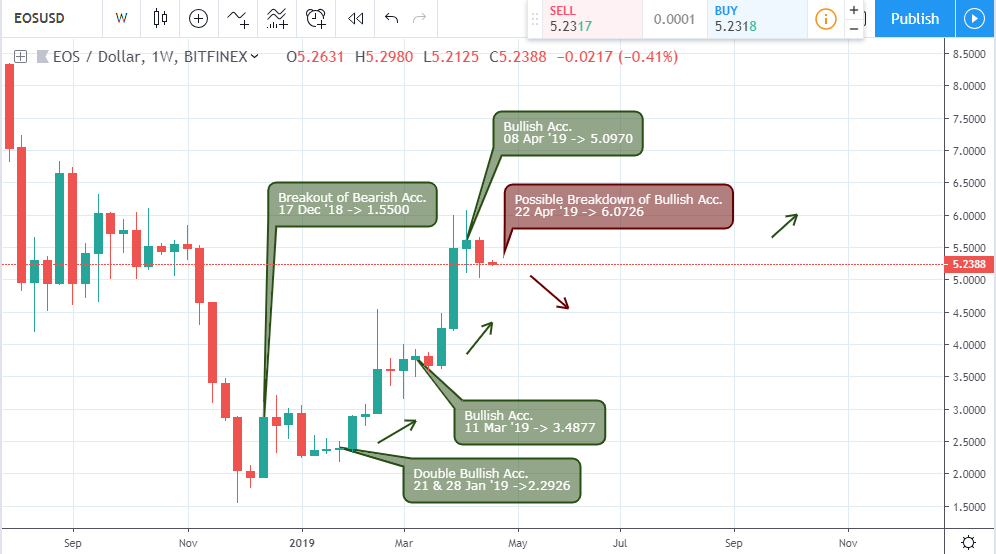
The above weekly chart of the EOSUSD illustrates a buildup of the weekly trend which started from a breakout of bearish accumulation on December 17 ’18.
Last week closed bearish slightly above the bullish accumulation support of April 08 ’19. A collapse of the 5.097 support level will confirm correction of the bullish gains.
4-Hour Chart
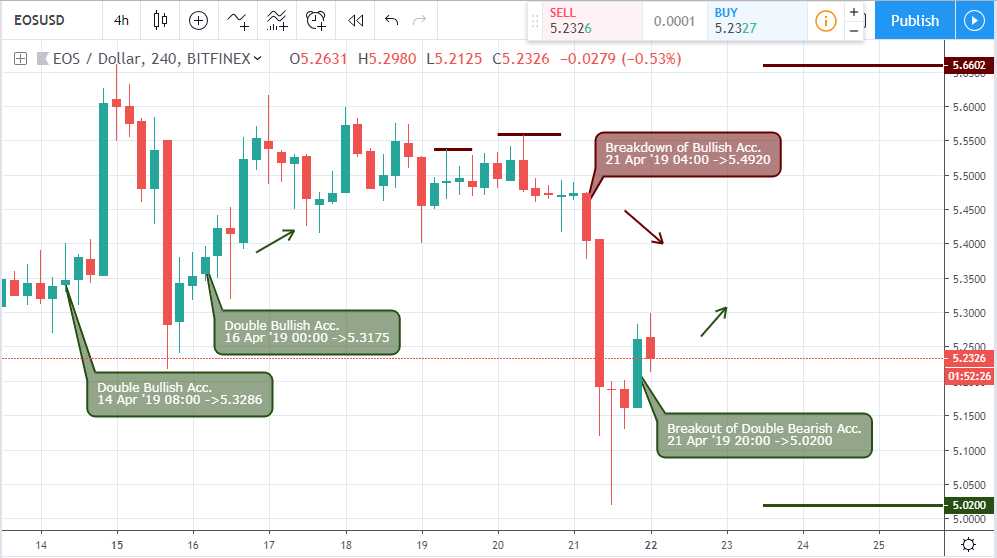
The daily chart, on the other hand, signals a breakout of bearish accumulation which is triggered above the weekly chart which shows bullish accumulation support of 5.0970.
Conclusion
The bearish closing price across major altcoins reveals the general overbought nature of the market. Market outlook such as these reveals an opportunity to extrapolate a percentage of your long position, to later enter after a retracement of the bullish trend.Disclaimer
Content provided by CryptoTraderNews is for informational purposes only, and should not be construed as legal, tax, investment, financial, or other advice. All information is of a general nature. As always, there is risk with any investment. In exchange for using our products and services, you agree not to hold CryptoTraderNews Pro, its affiliates, or any third party service provider liable for any possible claim for damages arising from decisions you make based on information made available to you through our services.