Ripple has been making waves in crypto news and FinTech and it is important to lay out the technical and fundamental outlook of XRP before adding this to your trading and investment portfolio.
Ripple launches operations in Brazil, expanding its presence as a leader in international cross-border payment provider using its enterprise blockchain solutions. The company already has over a dozen financial institutions from Brazil on RippleNet, which is a network of institutional payment providers like money services and banks to be a “frictionless experience” for sending money globally. Services on RippleNet, which includes Banco Rendimento, Santander Brazil, and BeeTech, enjoy a reduction in substantially lower transaction fees. For example, BeeTech on RippleNet drops from $20 USD to $2 USD and includes seconds-long transaction times compared to three to five days with Santander Brazil.
Ripple, the cross-border remittance platform, is seeing an increase of about two to three financial instruments added on the RippleNet per week. Let’s review some of the exciting news and technical price patterns that are driving the price of the XRP.
[rml_read_more]
RippleXRP: News
Ripple Partners with MoneyGram and Complies with AML Provisions.
The CEO of Ripple XRP, Brad Garlinghouse, announced a strategic partnership with MoneyGram, one of the largest money transfer companies. Garlinghouse said the strategic partnership is initially for two years and will enable MoneyGram to improve its operations as well make Ripple a key partner for foreign exchange settlement and cross-border payment using digital assets.
Coinfirm, a Redtech firm, will examine Ripple’s XRP compliance with Anti-Money Laundering (AML) provision.
XRPUSD: Monthly Chart
When compared to others in the cryptocurrency space, Ripple (XRP) has not made a huge rebound after the long crypto winter, as illustrated in the chart below. XRP prices have not yet reached the critical 0.236% Fibonacci retracement level but it’s important to note that the pair has established a sound support level at 0.24653 after a bear trap pattern was formed on 01 September ’18.
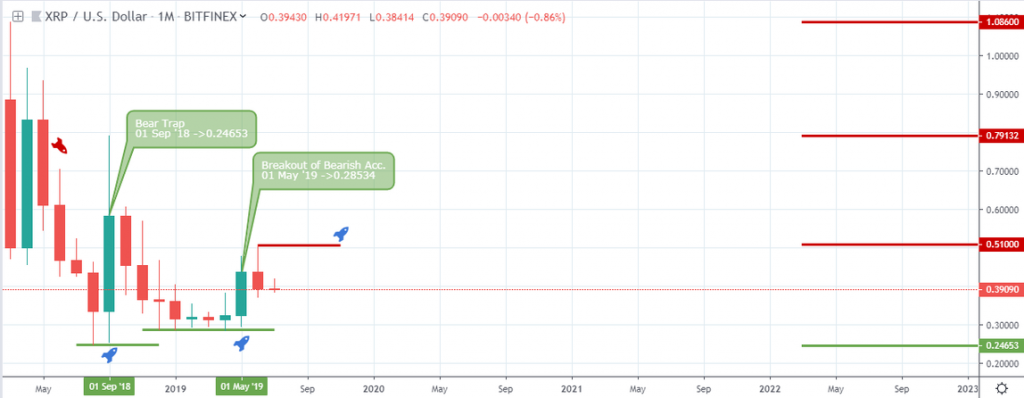
It later set up a higher low support at 0.28534 following a break above selling resistance on 01 May ’19. The XRP price hits resistance at 0.510 and closed bearish last month.
We’ll see more of the buildup on the lower intraday charts.
XRPUSD: Weekly Chart
Following a breakdown of a bullish accumulation from a high of 0.5700, the XRPUSD pair established bullish support from a counter breakout of bearish accumulation 17 December ’18, marking an end to the crypto winter of 2018.
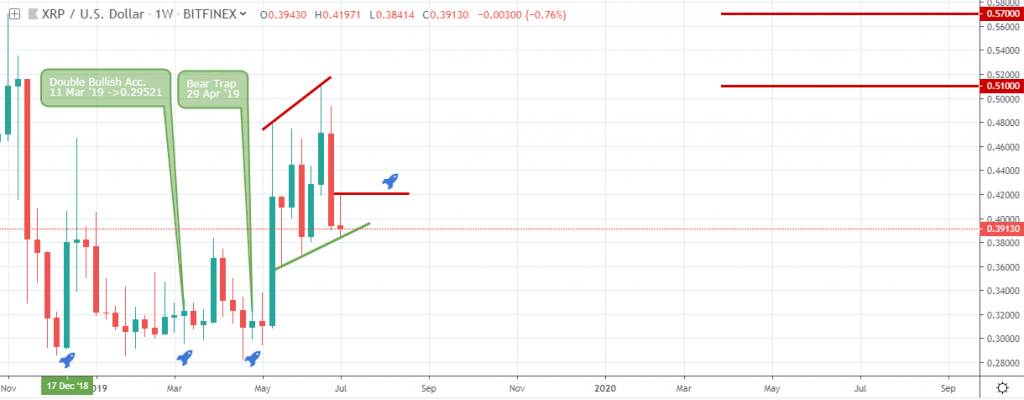
An increase in buying pressure on 11 March ’19, sets sound support at 0.29521, followed by a bear trap on 29 April ’19, together with forcing the price to a height of about 62.0%.
The pair enters into a series of deep parabolic swings after the initial bullish thrust on 13 May ’19, which formed an expanding bullish channel.
XRPUSD: Daily Chart
As indicated on the daily chart below, an expanding channel is formed signaled by opposing bearish and bullish divergence patterns on 26 June ’19, and a tentative hidden bullish divergence.
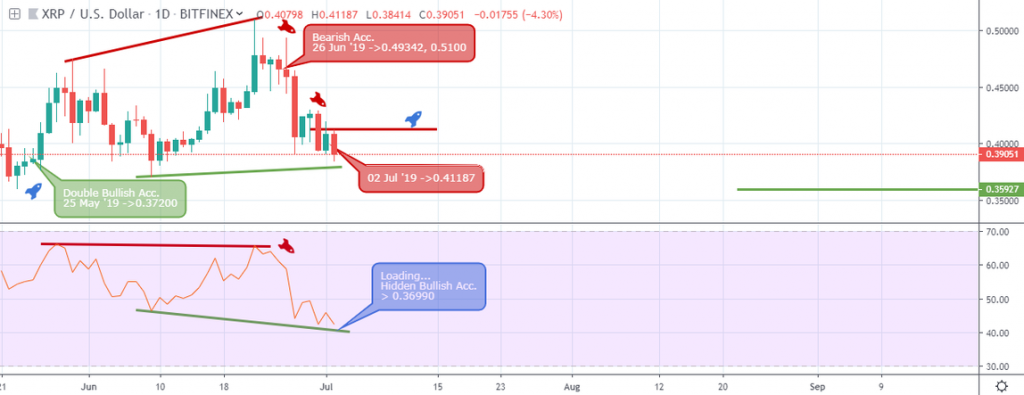
The channel is established following an earlier double bullish accumulation pattern was signaled on 25 May ’19 with support set at 0.3720.
XRPUSD: 4-hour Chart
Ripple XRP exited the overbought area on June 23 ’19 03:00 after about 18.0% increase in price from a bullish accumulation on June 20 ’19.
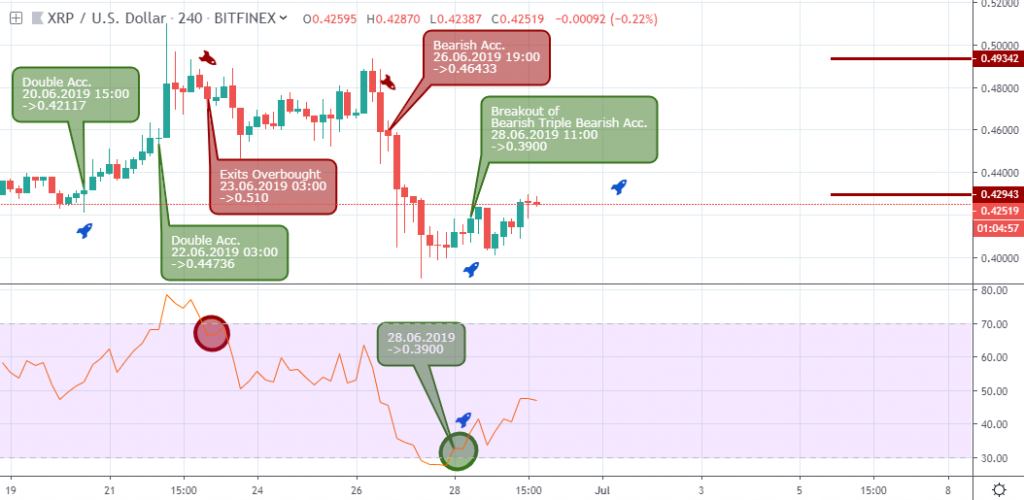
It’s been a roller coaster ride from that point as the pair entered and exits the oversold area on June 28 ’19, alongside signaling a breakout of bearish accumulation resistance.
At press time, XRP flags a double bottom pattern, showing a continuation of the bullish rally.
XRPUSD: 1-hour Chart
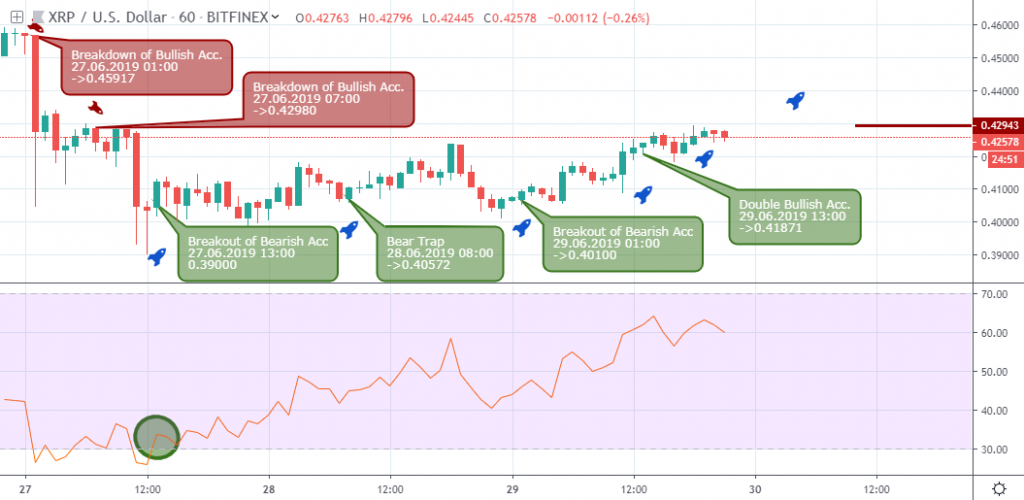
Just like the 4-hour time frame, the 1-hour overview of XRPUSD signals an increase in buying pressure, confirmed by a breakout of bearish resistance on June 27 ’19 13:00, following a 14.0% price decline.
Conclusion
Despite a massive 30% dip from a high of about $387.4 Billion USD of the total cryptocurrency market capitalization, the cryptocurrency market still looks bullish on the higher monthly time frame.
The chart below is an update to the 4-hour time frame showing a regular bullish divergence signaled on 02 July ’19 07:00, with established support at 0.38414.
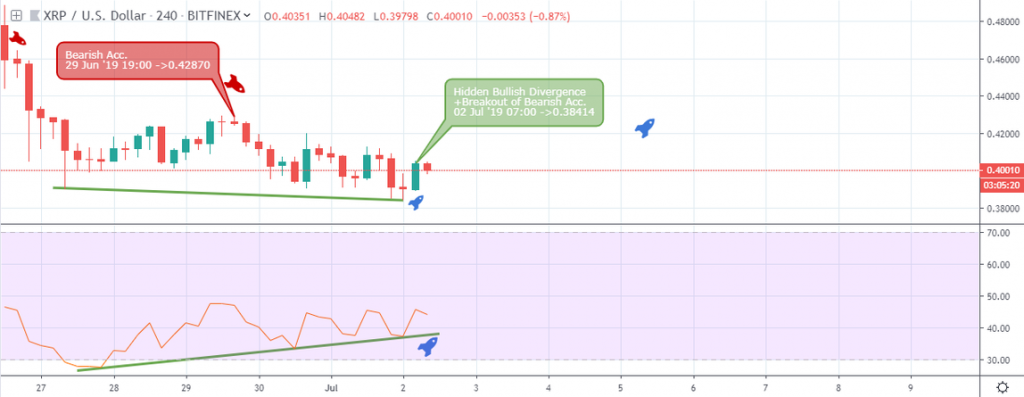
We consider this a probable bullish entry setup to buy some XRP, and recommend you do so by putting up good risk and money management measures to protect your capital.
Disclaimer
Content provided by CryptoTraderNews is for informational purposes only, and should not be construed as legal, tax, investment, financial, or other advice. All information is of a general nature. As always, there is risk with any investment. In exchange for using our products and services, you agree not to hold CryptoTraderNews Pro, its affiliates, or any third party service provider liable for any possible claim for damages arising from decisions you make based on information made available to you through our services.
1 comment
[…] Ripple (XRP) […]
Comments are closed.