
It is without question that traditional and crypto market predictions and assessments are based on divergence, price swings, trend strength, and momentum. Knowing what to look for plays a key role in the potential for making a profit – or cutting one’s losses.
When market momentum begins to slow, it’s important to note that this does not always signal a reversal. Sometimes it means that the market players are beginning to consolidate before a new trend begins. When comparing price swings with a basic timeline, traders get a peek at the momentum and have a good idea which direction it may be heading.
Divergence
Divergence setups are low-risk ways of buying close to the bottom of a bearish wave or selling close to the top of a bullish wave.
Imagine if you had the ability to project a valid exit point to turn a profit on an altcoin investment, or another scenario where you can anticipate the bottoming of a crypto asset for a low buy in entry point. Can you visualize the profit gains?
The technical tool to achieve this is through divergence setups.
[rml_read_more]
Divergence setups involve a comparison of the extreme price peaks and valleys to an oscillator of your choice. The oscillators, in this case, can be the Relative Strength Index (RSI), MACD, and CCI, among others.
Divergence setups are leading indicators that can potentially gain the most profit on trades when in combination with other tools. This is because trading divergence patterns assure you of low risk to reward entry.
Market Momentum
Market momentum is measured by the length of short-term price swings which are determined by the price pivots of the highs and lows. Steep slopes indicate strong momentum while shallow slopes and short price swings usually demonstrate weak momentum. Below, we will examine the divergence patterns and how it affects market momentum.
How to Trade Divergences in the Cryptocurrency Market
Ideally, the price and oscillator charts should flow in the same direction. If the price and oscillator should flow in a corresponding manner. So, if the price is reaches higher highs, the oscillator should also reflect that.
Divergence, on the other hand, occurs when the oscillator is moving in a different direction. For example, the price chart is reaching a higher high, while the oscillator makes a lower high at the same time.
One reason divergence patterns are an excellent tool to have in your tool kit is they show a continuation of a trend either in the bullish or bearish direction, often revealing weaknesses that can be taken advantage of within a trend.
Divergence patterns are of two types: Regular and Hidden
Technical analysts and traders often define divergence in reference to situations that occur on a chart where a new extreme point in the price level does not result in the concurrent extreme in value.
Regular Bullish Divergence
The regular bullish divergence occurs at the end of a bearish trend, where the price makes lower lows (LL) while the oscillator makes higher lows (HL).
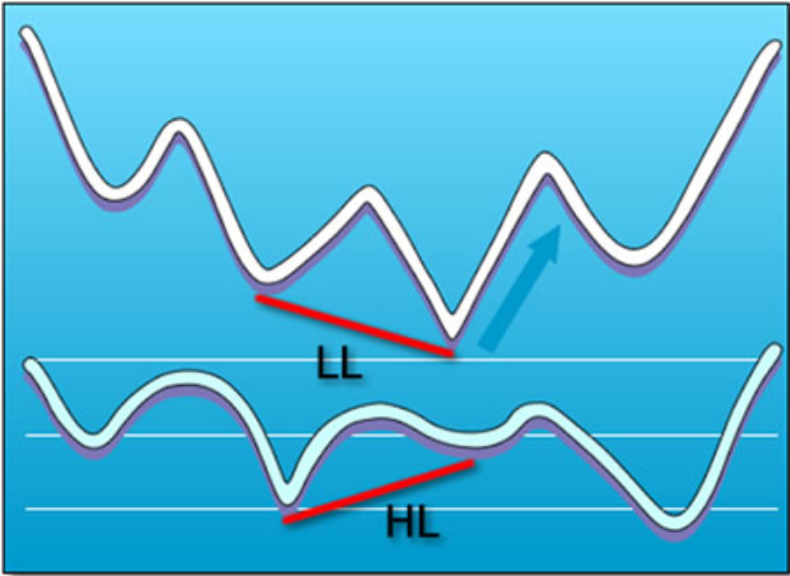
The following rules have to be met to confirm a regular bullish divergence:
Where point B is the current low, and Point A is the previous low.
- At point B, the price makes a lower low compared to the oscillators’ higher low.
- At point A, the price makes a higher low compared to the oscillators’ low, as shown in the image.
Regular Bearish Divergence
In the case of a regular bearish divergence, while the price maintains a bullish trend, the current (second) high of the price makes a higher high (HH), compared to the oscillators lower higher (LH).
A dead cross of the oscillator generally confirms the price reversal in the opposite direction.
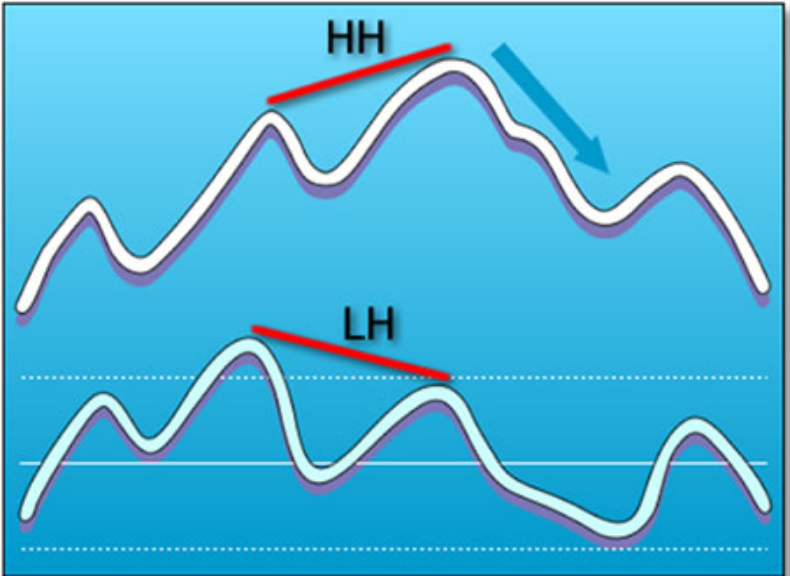
The illustrations reveal regular divergence patterns, which helps determine entry points into peaks and bottoms for buying in at a low.
Hidden Divergence
Here we’ll be looking at a variant of divergence that does not signal a change in trend direction, but rather a continuation of the current trend.
The hidden divergence pattern is one that aligns with the famous saying in trading, “The trend is your friend until the bend at the end.”
Just like the regular divergence pattern, the hidden divergence pattern can be bullish or bearish.
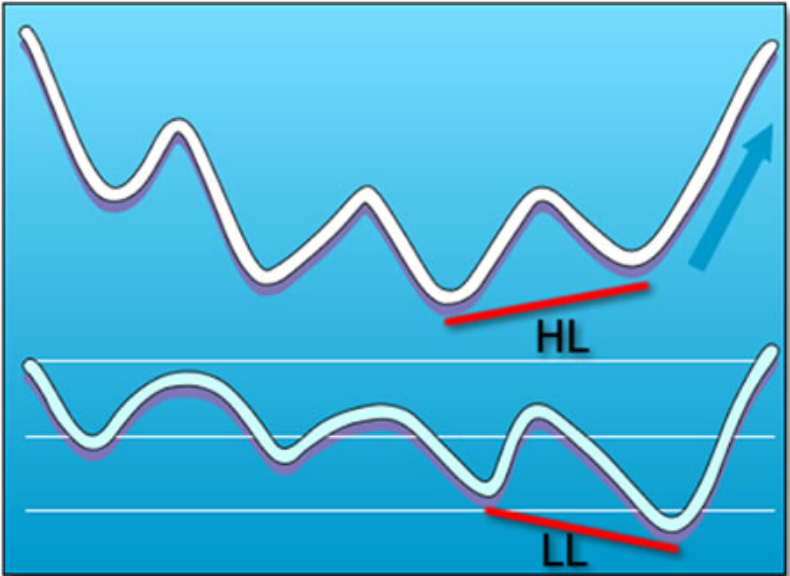
Hidden Bullish Divergence
The hidden bullish divergence is flagged when the current, or second low of the price makes a higher low (HL) compared to the oscillators’ lower low (LL). This pattern is typical when a cryptocurrency is in a bullish trend.
Hidden Bearish Divergence
The hidden bearish divergence is the opposite of the hidden bullish divergence in that it signals the continuation of a bearish trend, which occurs when the price makes a lower second high (LH) while the oscillator forms a higher high (HH).
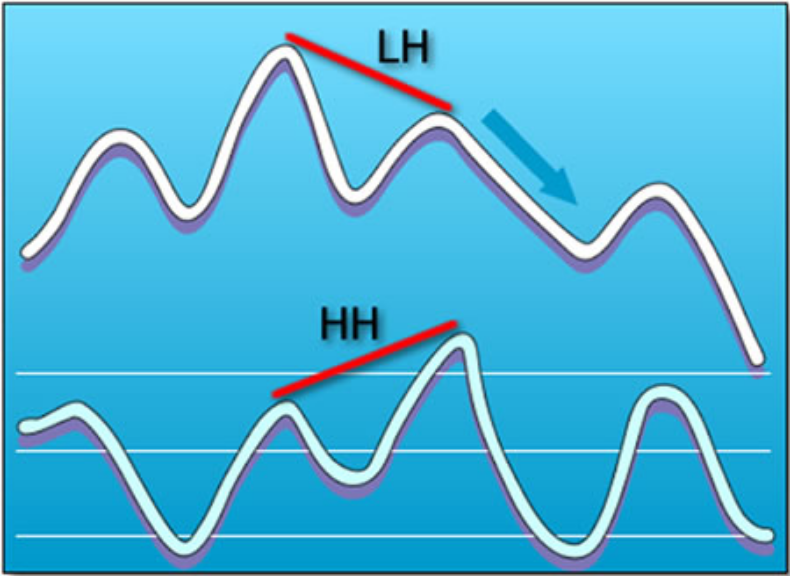
Hidden bullish or bearish divergence patterns are best suited for trend followers and hybrid traders alike. If you can master the art of identifying these divergence patterns, your trading performance should have a marked improvement.
Keep this in mind
Regular divergence patterns signal a probable trend reversal, while hidden divergence indicates a continuation of the trend.
Below are real-life examples where we spot regular and hidden divergence patterns on the chart of the BTCUSD.
Regular Bullish Divergence BTCUSD
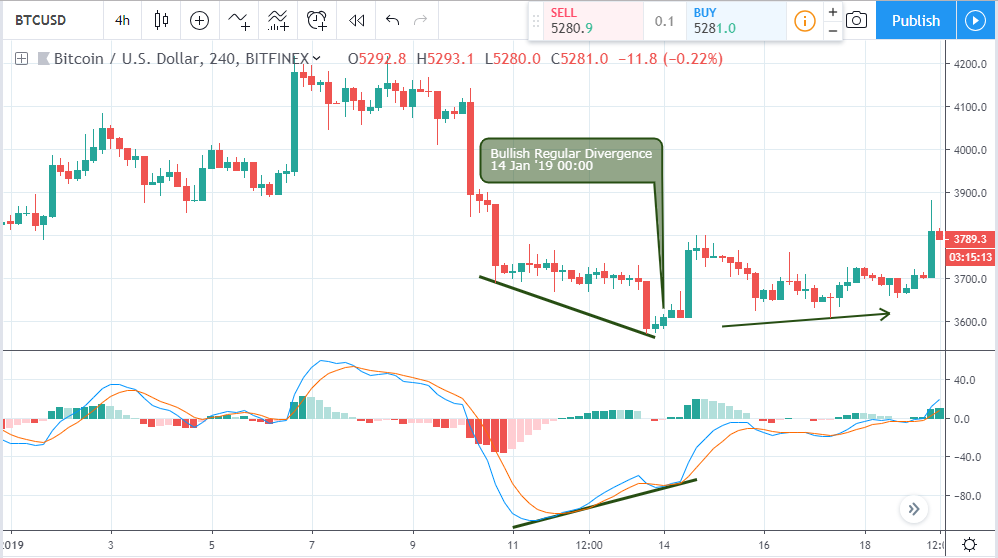
This pattern compares the lows of price to the MACD (9, 21, and 5) oscillator. If the price chart is making lower lows, while the MACD is making a higher low, a regular bullish divergence is triggered as shown on the image above.
Regular Bearish Divergence BTCUSD
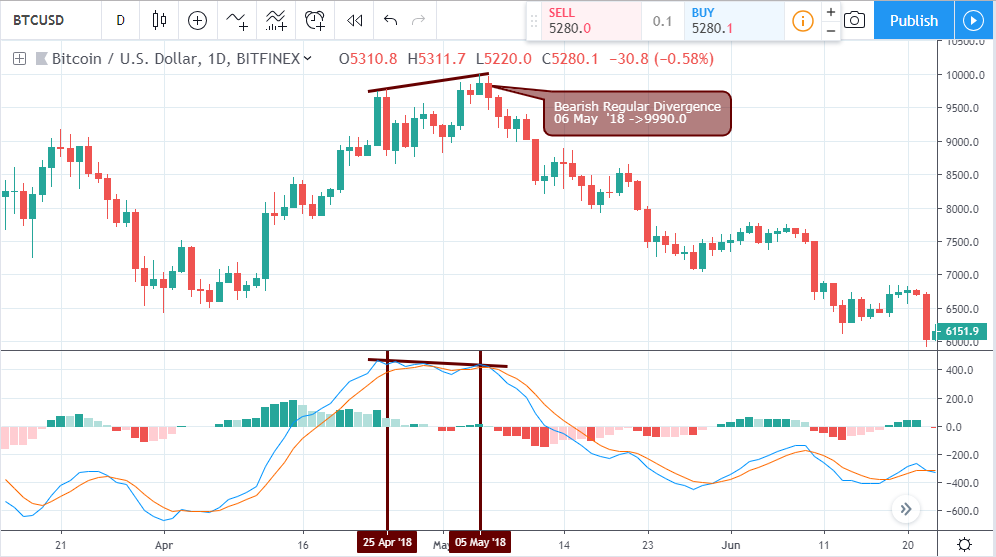
The bearish regular divergence pattern is opposite of the bullish variant. In this scenario, the price chart is making higher highs while the MACD oscillator makes lower highs as shown with the trend lines on the above chart.
Hidden Bullish Divergence BTCUSD
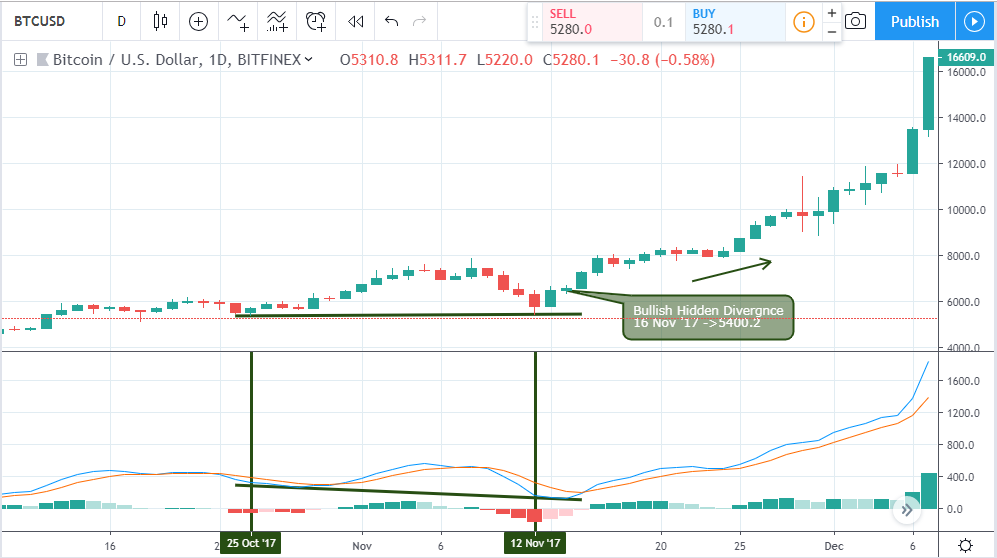
This divergence setup triggers bullish trend continuation by comparing the lows of price to the lows of the MACD oscillator. Shown with trend lines on the above chart, if the price chart is making higher lows, while the MACD makes lower lows, a bullish hidden divergence is triggered.
Hidden Bearish Divergence BTCUSD
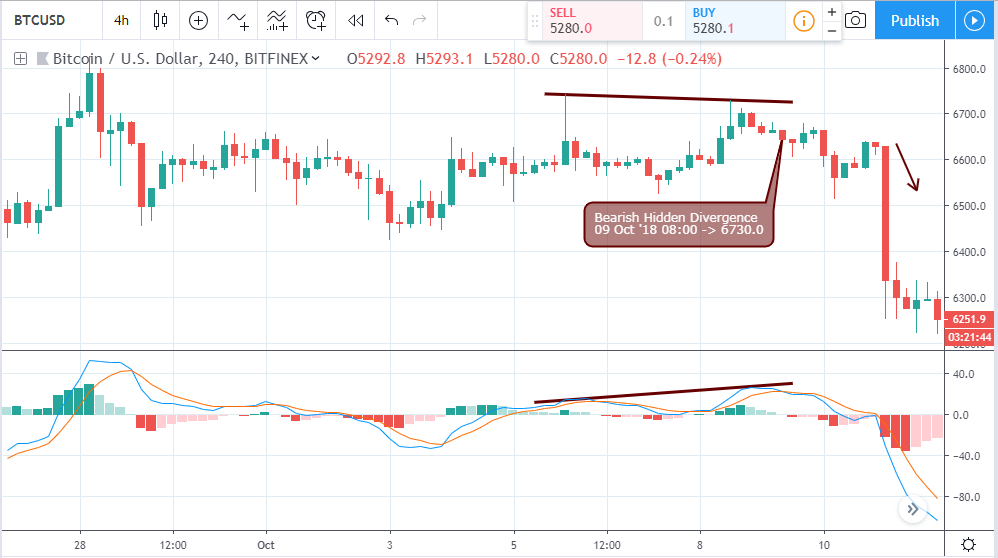
A bearish hidden divergence shows a continuation of a bearish trend, where the price chart makes lower highs, compared to the MACD higher highs as shown with trend lines on the above chart.
Disclaimer
Content provided by CryptoTraderNews is for informational purposes only, and should not be construed as legal, tax, investment, financial, or other advice. All information is of a general nature. As always, there is risk with any investment. In exchange for using our products and services, you agree not to hold CryptoTraderNews Pro, its affiliates, or any third party service provider liable for any possible claim for damages arising from decisions you make based on information made available to you through our services.