
Like so many other cryptocurrencies in the last quarter, Ethereum also had a good quarter experiencing a steady rise in price over the quarter under review.
[wlm_private “Crypto Trader Pro – Monthly|Crypto Trader Pro – Yearly|Crypto Trader Pro (Lite)”]
Opening the quarter on April 01 with price pegged at $129, ETH price continued to display relative stability and steady growth over the quarter. Though there were a few bear-runs here and there, the Q2 saw more bull-runs for the cryptocurrency with the $139 opening price of April representing its bottom price.
By the close of June, ETH was trading at $335—its highest price since Q3 of 2018. This uptick in price means that Eth price recorded a whopping 114% increase in price from its opening price.
Below we shall explore some other significant happenings within the quarter.
ANNOUNCEMENTS
Ethereum devs announced its agreement to include two updates in its next Hard Fork called Istanbul. The upgrades scheduled for October will enable the decentralized crypto platform to verify and authenticate blockchain data quicker than it does.
RESEARCH CONCLUSIONS
Two different research organizations researched Ethereum in Q2, and both came up with positive conclusions.
One study found that in Q2, the Ethereum platform was still the number one choice for developers to build decentralized apps. According to the survey carried out by Dapp.com, in Q2 alone, there are over 1,600 decentralized apps on the Ethereum platform.
However, the research established that rival platform TRON, boasting over 445,000 active users on its platform had a higher number of active users than Ethereum, which had just 365,112.
Ethereum had 664 Dapps, against TRON’s 338.
Another study that analyzed cryptocurrency-based conversations on Reddit established that Ethereum is the second most discussed digital coin. The Pacific Northwest National Laboratory carried out the research.
EVENTS
Also, Q2 witnessed the Ethereal summit held on May 10 in New York. The summit held at Pioneer Works in Brooklyn showed that the crypto ecosystem is reaping the developmental benefits of work done in previous years. The summit featured programmers, coders, and entrepreneurs from all over the globe, gathering to share ideas and offer insights into the market.
Technical Analysis
Read on as we analyze and identify the significant technical levels driving the Ether ETH price.
ETHUSD: Monthly
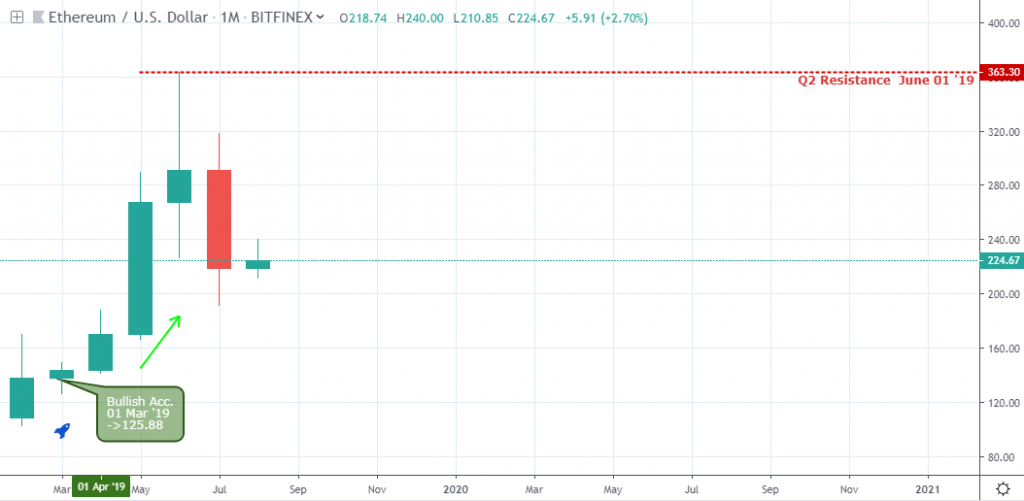
The bullish accumulation price pattern signaled at the last month in Q1 suggested a continuation of consecutive bullish closing bars on the monthly chart of the ETHUSD, after setting a healthy support level at $125.88.
On the last day of Q2, the monthly price chart signaled a spinning top reversal candlestick pattern and set resistance at $363.30 mark.
ETHUSD: Weekly
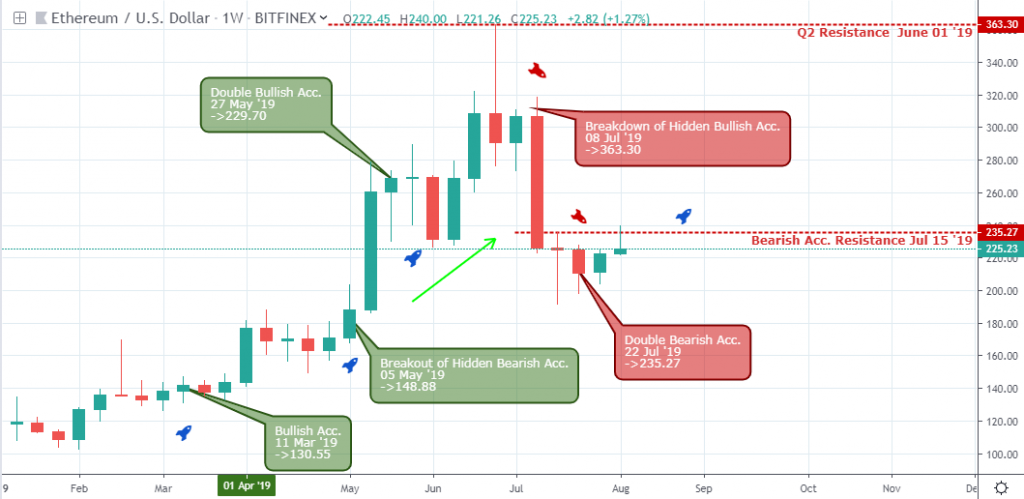
Moving a step lower to the weekly time frame, the ETHUSD established a series of higher supports following a bullish accumulation candlestick pattern on March 11 ’19 ($130.55) and a breakout of hidden bearish accumulation on May 05 ’19 ($148.88).
The double bullish accumulation support at $229.70 held the bears from a further decline in May ’19. After a formation of a shooting star candlestick pattern signaled at the last day in June ’19, the bears broke below hidden bullish accumulation support on July 08 ’19 (Q3) and confirmed the shooting star resistance of $363.30.
ETHUSD: Daily
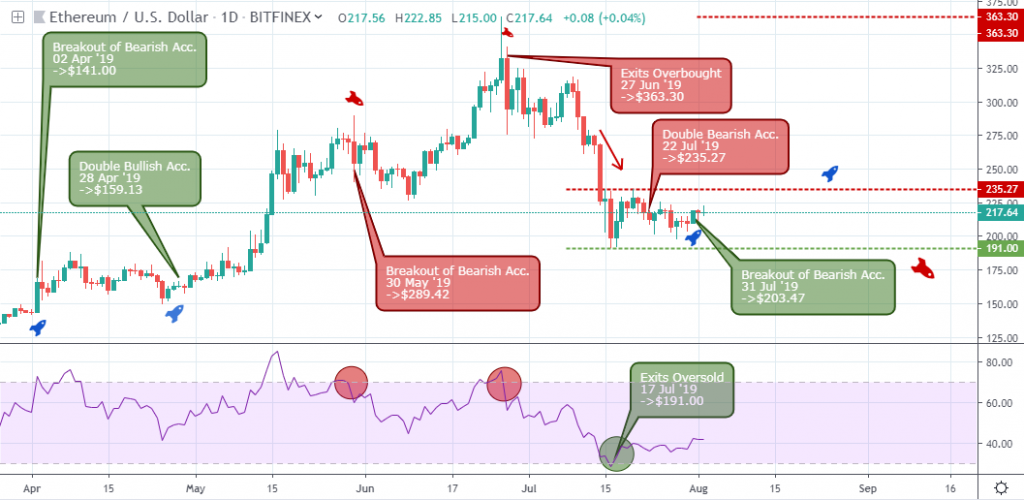
Looking at the above daily time frame, we quickly observed an increase in buying power on April 2 as the Ether ETH price breaks out of bearish accumulation resistance, with support at $141.00.
Following correction of the earlier price surge in mid-April, the pair again resumed the bullish trend by signaling a double bullish accumulation on April 28 for about 121.6% price increase.
The breakout of double bearish accumulation in May ’19 sets reliable support at $227.20, which later served as a springboard on June 10, ’19.
An exit of the overbought area (June 27 ‘19) from the daily time frame alongside a drying up of demand for ETH compared to Bitcoin BTC resulted in the price plunge into the early parts of Q3.
Conclusion and Projection
An increase in Bitcoin BTC dominance at the end of the second quarter drives the price of altcoins into a bearish spiral of which it did not leave the Ether ETH out of the battery.
For us to have a definite conviction to resume long positions in the ETHUSD, we have to see a combination of bullish price action patterns while the Ether ETH price comes out of the oversold territory. Such is a breakout of bearish accumulation on July 31 ’19 after the ETHUSD exits the oversold area on July 17 ‘19.
[/wlm_private]
Want to read the rest of the article? Join our pro-membership and receive all of the following:
✅Access to ALL content.
✅Access to the CTN editorial staff.
✅Access to our CTN trading dashboard.
✅Access to our exclusive telegram channel where all our pro-members and editorial staff are in.
✅Ability to request content/research material!